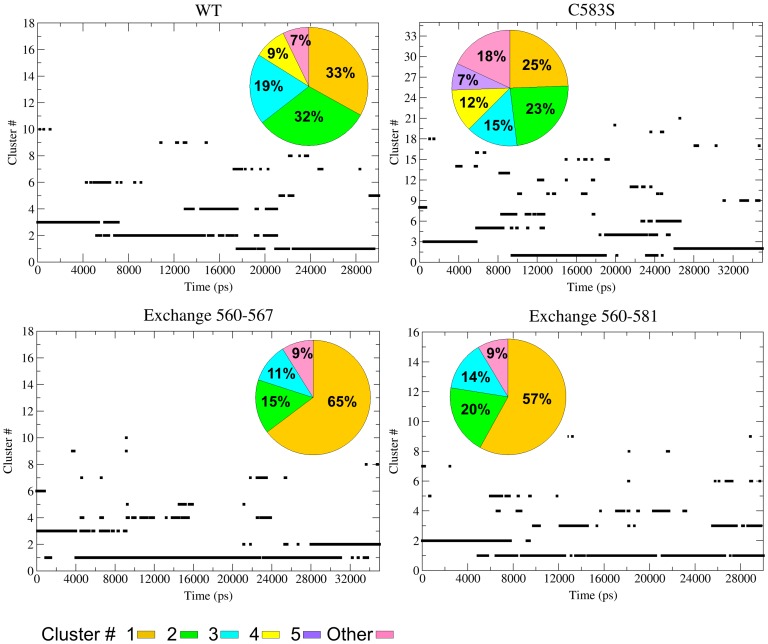
Figure 5. Cluster analysis of WT, C583S and two exchange simulations.
The figure depicts the results by two presentations for the four simulations as indicated in each panel. The main panel in each frame shows the transitions between clusters (identified on the ordinate by numbers) along the trajectories. The relative fraction of the dominant clusters is presented by the colored histogram. The clusters are numbered sequentially from the most (#1) to the less popular. The identity of the system under analysis is marked in the frames.

