
Figure 4. Myocardial levels of SERCA2 in PDE5-TG and WT after 10 weeks TAC.
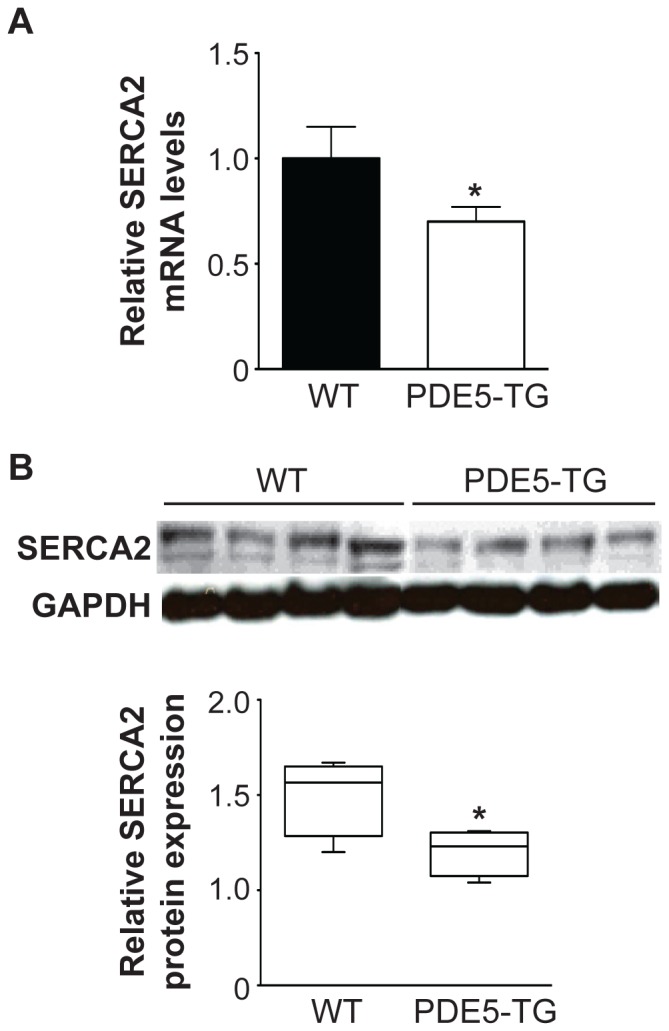
Transcript levels (A) and protein levels (B) of SERCA2, measured using RT-qPCR and immunoblot and densitometric analysis, respectively, were significantly lower in PDE5-TG than in WT. Transcript and protein levels of GAPDH were measured for normalization. * P<0.05 vs WT.