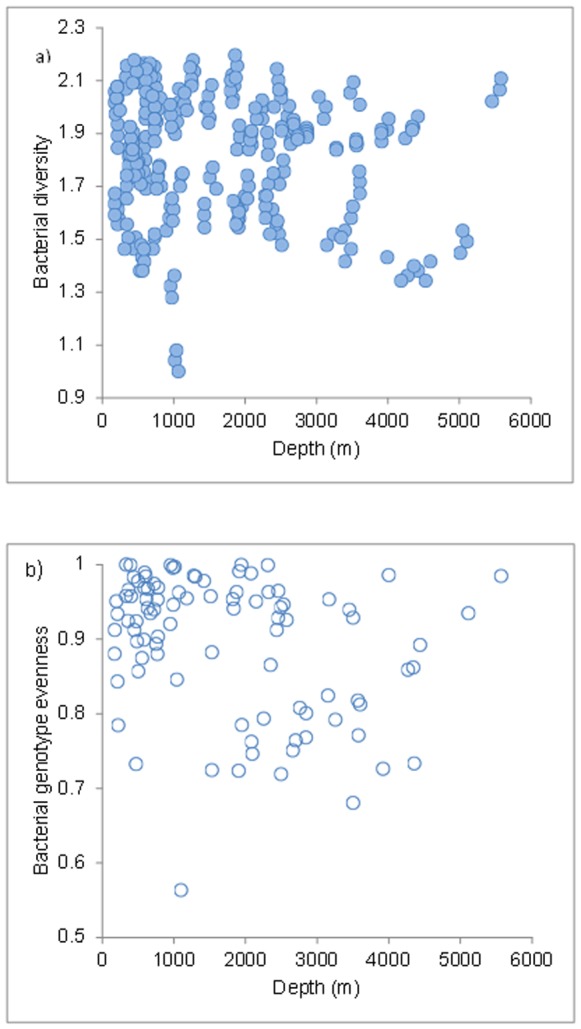
Figure 4. Spatial patterns of bacterial diversity as genotype richness.

Reported are bathymetric gradients of A) bacterial diversity and B) Bacterial Evenness (ARISA). Data are from the Arctic (n = 42), North Atlantic (n = 33), central Atlantic (n = 100) and Mediterranean Sea (n = 113) (Sources = HERMIONE project and the Pangea database).
