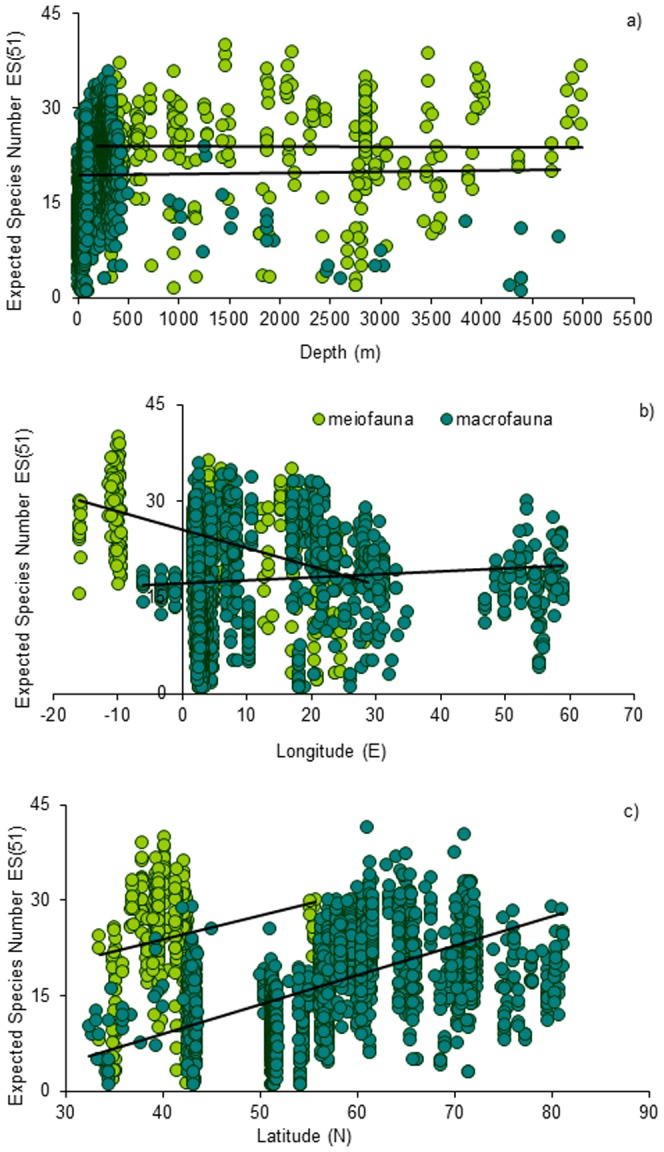
Figure 5. Spatial patterns of meiofaunal and macrofaunal diversity as ES(51).

Reported are A) bathymetric gradient, B) longitudinal and C) latitudinal. The equations of the fitting lines are: y = −5e−05×+24.1 (n = 306, R2 = 7e−0.5, ns for meiofauna, y = 0.0002×+19.4 (n = 2226, R2 = 7e−05, ns for macrofauna along the bathymetric gradient; y = −0.29×+25.5 (n = 306, R2 = 0.18, p<0.01) for meiofauna, y = 0.05×+17.15(n = 2789, R2 = 0.07, ns) for macrofauna along the longitudinal gradient; y = 0.37×+8.9 (n = 306, R2 = 0.04, ns) for meiofauna, y = 0.46×−9.3 (n = 2821, R2 = 0.30, p<0.01) for macrofauna along the latitudinal gradient (sources for macrofaunal data: Rees et al. [39], Kröncke et al. [78],.new data for the deep Mediterranean Sea and Atlantic margin; meiofauna Danovaro et al. [41] and 108 additional sites from the Mediterranean and Atlantic Margins). Overall 3130 sampling sites were assembled covering the European margins from continental shelves to the deep-sea floor (down to ca. 5000 m depth).
