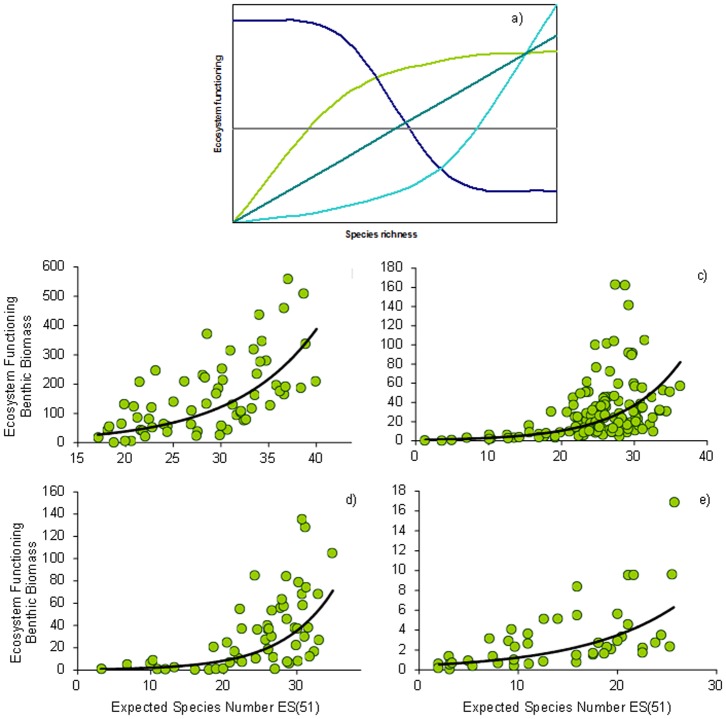
Figure 6. Marine biodiversity, functional diversity and ecosystem functioning.
A) Conceptual diagram drawn using data from the North-Eastern Atlantic and Mediterranean Sea (Dark green: positive linear relationship between biodiversity and ecosystem functioning indicating the presence of functional complementarity among species; Light green: saturating relationship between biodiversity and ecosystem functioning indicating functional redundancy; Purple line: non-linear negative relationship between biodiversity and ecosystem functioning indicating a possible effect of selection of the few best performers; Blue line: positive and exponential relationship between biodiversity and ecosystem functioning indicating a positive interspecific interaction, such as facilitation)..([22], [43], [80]). (B-E) The relationship between expected species number [ES(51)] and ecosystem functioning (as benthic biomass µgC 10 cm-2) for nematodes are based on European data from Danovaro et al. [41] with new data from 198 sites from the Atlantic margins and Mediterranean Sea. The equation of the fitting lines are: b) y = 3.84e0.12×(n = 64, R2 = 0.41, p<0.01) in the North-east Atlantic; c) y = 0.44e0.10×(n = 45, R2 = 0.45, p<0.01) in the Eastern Mediterranean; d) y = 0.50e0.14×(n = 55, R2 = 0.46, p<0.01) in the Central Mediterranean and e) y = 0.86e0.13×(n = 128, R2 = 0.52, p<0.01) in the Western Mediterranean.

