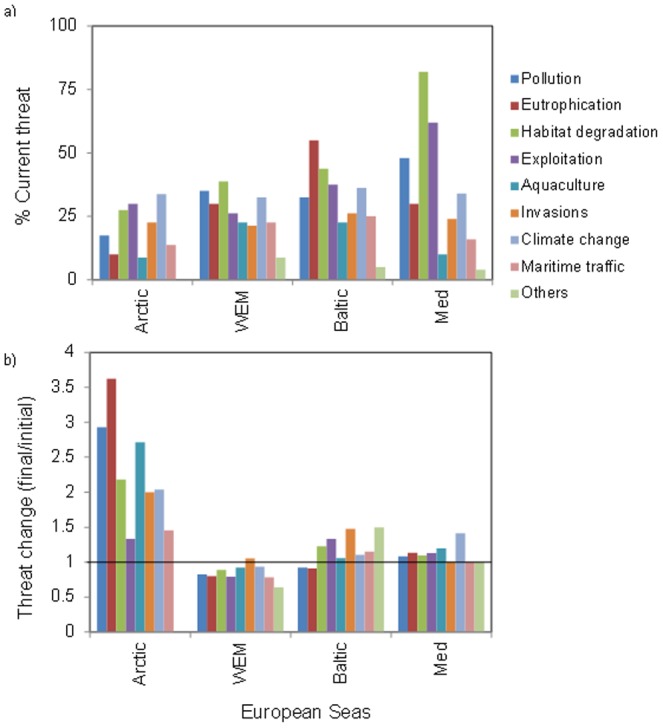
Figure 7. Qualitative ranking of potential threats to biodiversity from natural and human impacts.

Threats were assessed for both A) current conditions and B) expected conditions in 10 years: the average value for each future threat was subtracted from the current perceived threat for comparison among regions. A negative value in the plot suggests predicted lessening of the threat (modified from Coll et al. [9] and Costello et al. [31]).
