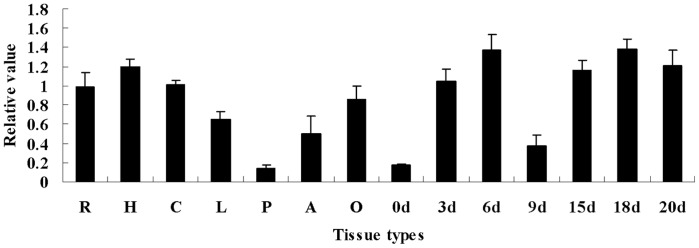
Figure 2. RT-PCR analysis of expression of GhGalT1 in cotton tissues.

Total RNA was isolated from different cotton tissues. R: roots; H: hypocotyls; C: cotyledons; L: leaves; P: petals; A: anthers; O: 15 DPA (day post anthesis) ovule; 0d: 0 DPA ovules and fibers; 3d: 3 DPA ovules and fibers; 6d: 6 DPA ovules and fibers; 9d: 9 DPA fibers; 15d: 15 DPA fibers; 18d: 18 DPA fibers; 20d: 20 DPA fibers.
