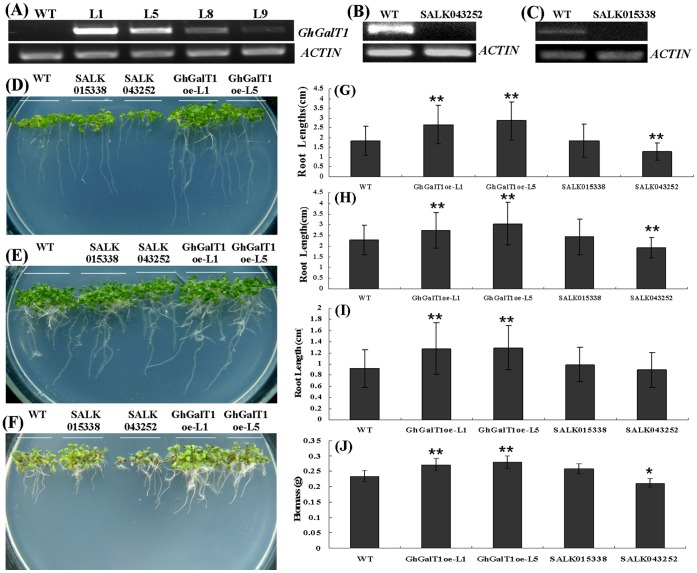
Figure 4. Assays in the growth status of GhGalT1 overexpression transgenic Arabidopsis seedlings under light condition.
(A) RT-PCR analysis of GhGalT1 expression in transgenic Arabidopsis. (B) RT-PCR analysis of At3g14960 expression in SALK 043252 mutant. (C) RT-PCR analysis of At1g53290 expression in SALK 015338 mutant. (D) to (F) Nine-day-old seedlings of GhGalT1 transgenic lines, wild type and mutants growing on 1/2 MS without sugar (D), 1/2 MS with 1% sucrose (E) and 1/2 MS with 100 mM sucrose (F). (G) to (I) Statistical analysis of the relative root length of nine-day-old seedlings of GhGalT1 transgenic lines, wild type and mutants growing on 1/2 MS without sugar (G), 1/2 MS with 1% sucrose (H) and 1/2 MS with 100 mM sucrose (I). (J) Statistical analysis of the relative biomass (g/30 seedlings) of nine-day-old seedlings of GhGalT1 transgenic lines, wild type and mutants growing on 1/2 MS with 1% sucrose. Error bars represent standard errors of three replicates. Asterisk represents significant difference (one asterisk: P value<0.05; two asterisk: P value<0.01) between the transgenic lines and wild-type by t-test. WT: wild type; GhGalT1oe-L1 and -L5: GhGalT1 overexpression transgenic line 1 and 5; SALK 043252 and SALK 015338: two T-DNA insertion mutants. The assays were repeated three times along with three independent repetitions of the biological experiments.

