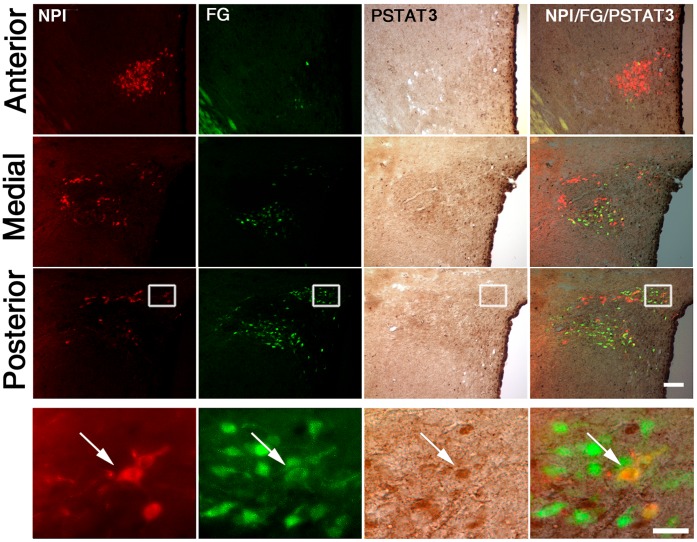
Figure 3. ICV leptin increased pSTAT3 in OXT neurons of the PVN projecting to the NTS.
Upper sets of panels depict low magnification photomicrographs of the anterior, medial and posterior parts of the PVN of rats with stereotaxic injections of FG in the NTS and ICV treated with leptin. Right column of images shows merge of NPI (red fluorescent staining), FG (green fluorescent staining) and pSTAT3 (brown staining) signals. Bottom set of panels show high magnification photomicrographs of area marked in low magnification images, with arrow pointing to a triple-labeled cell. Scale bars: 50 µm (Upper panels), 20 µm (Bottom panels).

