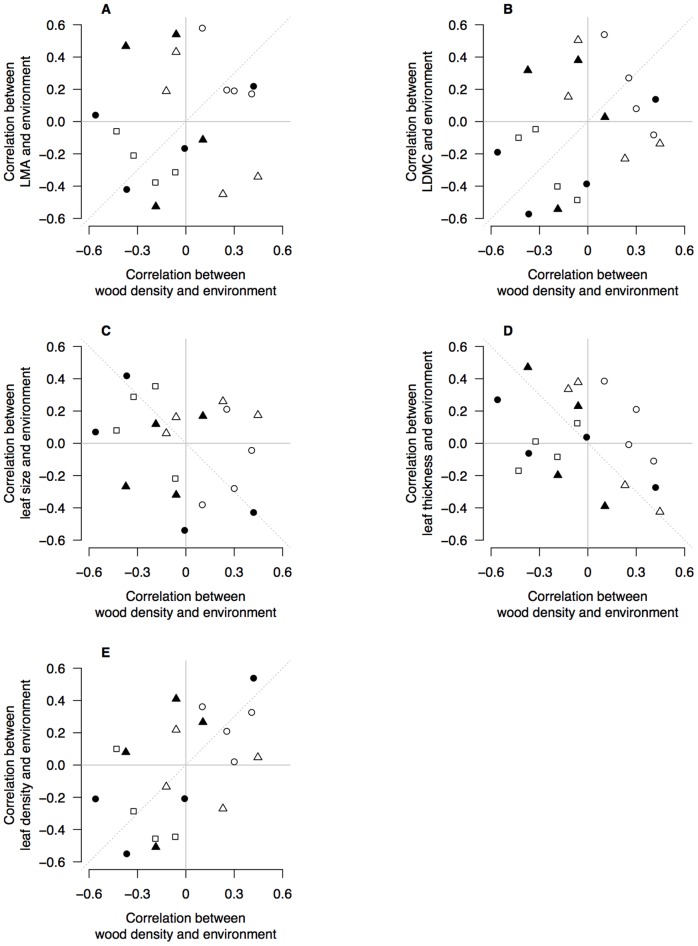
Figure 4. Correlation coefficients of environmental variables with wood density and leaf traits.
Biplots show correlation coefficients between wood density and five environmental variables (x-axis), and correlation coefficients between leaf traits and environmental variables (y-axis). Each data point is a pair of correlation coefficients for a species. In each panel, the correlations between wood density and an environmental variable are plotted against the correlation coefficients for a leaf trait and the same environmental variable. There are four points representing each species, for each environmental variable. Open circles are correlations with MAR; filled circles are correlations with Latitude; open triangles are correlations with MAT; filled triangles are correlations with Elevation; open squares are correlations with soil P. Dashed line shows the 1∶1 relationship expected from interspecific trait correlations e.g., that wood density and LMA are positively correlated [37]–[39] and therefore so should their relationships with environment.

