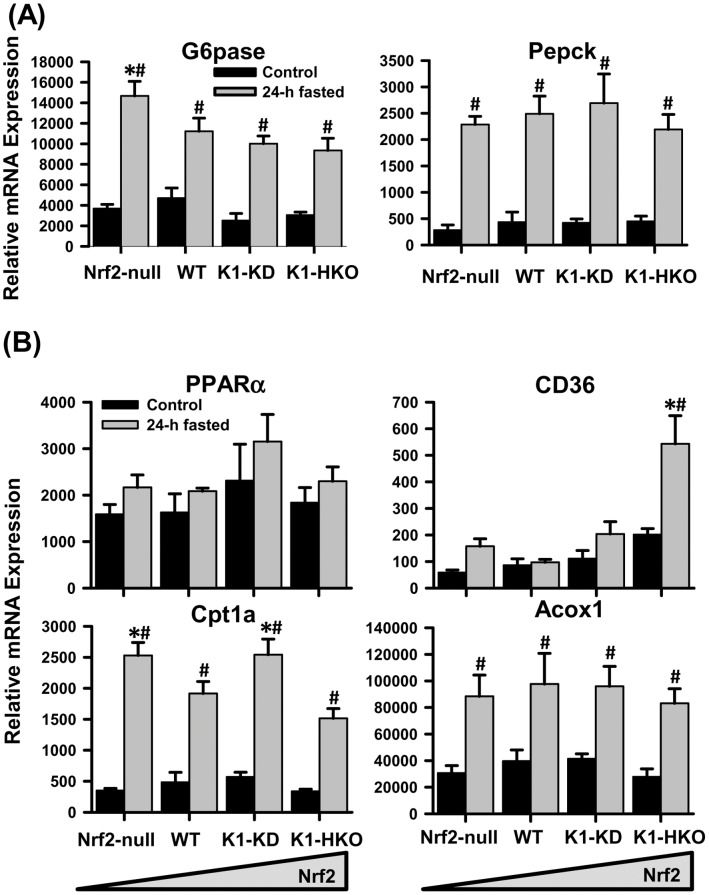
Figure 3. Hepatic expression of genes involved in glucose and lipid metabolism.
(A) Messenger RNA of genes encoding key enzymes for gluconeogenesis. (B) Messenger RNA expression of PPARα and genes involved in fatty acid catabolism. Data are presented as mean ± S.E. (n = 5). Two-way ANOVA was performed with genotype and treatment as main factors. Significant main effects and interactions were followed by Student-Newman-Keuls comparisons to assess the differences between groups. Asterisks (*) represent statistical differences (p<0.05) compared with WT mice on the same treatment. Pounds (#) represent statistical differences (p<0.05) between fasted and control mice of the same genotype.

