
Figure 11. Comparison of strategies.
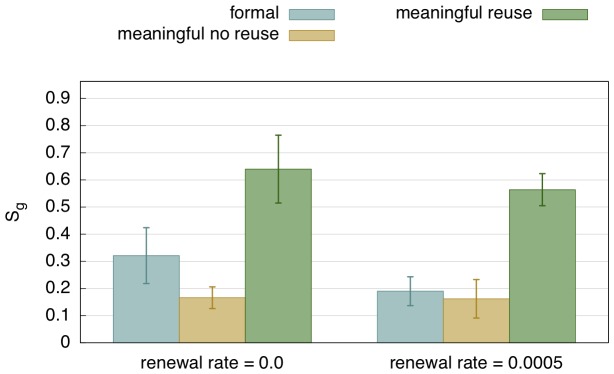
This graph compares the efficiency of the formal marker strategy, the meaningful strategy without reuse, and the reuse strategy for the last 10 games of a run with 5000 games. Left is without population change and right with population change. Average for 50 runs with standard deviation. The reuse strategy is significantly more efficient, even in the case of population turnover. Unsurprisingly, a changing population (shown on the right) makes it harder for the agents to bootstrap an initial system.