
Figure 7. Computer generated model of trimeric gp120 and human SP-D.
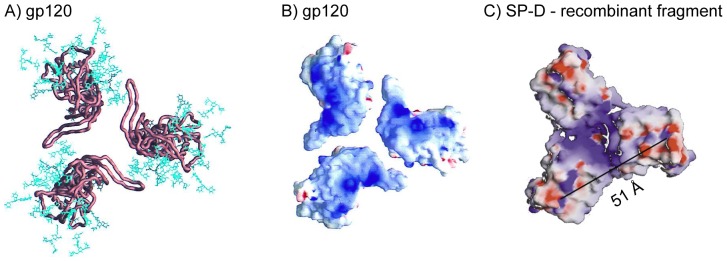
A: Cα worm representations of core gp120 (copper brown) and the gp120 carbohydrate cores (blue), the (N-acetylglucosamine)2-(mannose)3cores shared by both high-mannose and complex N-linked glycan moieties. The carbohydrate shown here represents approximately half the carbohydrate on gp120, with the rest extending further from the gp120 surface. Distance from glycan tip to glycan tip is estimated to be 110 Å. View from target cell membrane. B: The electrostatic surface of gp120 for the core. The electrostatic potential is depicted at the solvent-accessible surface, which is colored according to the local electrostatic potential, regions of positive potential are shown in blue and negative potential is in red. View from target cell membrane. C: The electrostatic surface potential of the recombinant fragment of hSP-D. The molecule is shown looking directly on top of the CRDs. Regions of positive potential are shown in blue and negative potential is in red. The distance between two carbohydrate binding calcium ions is 51 Å and indicated on the figure. A and B from Kwong et al [48] with permission. C modified from Hakansson et al [49]with permission. B and C visualized using the program GRASP [64].