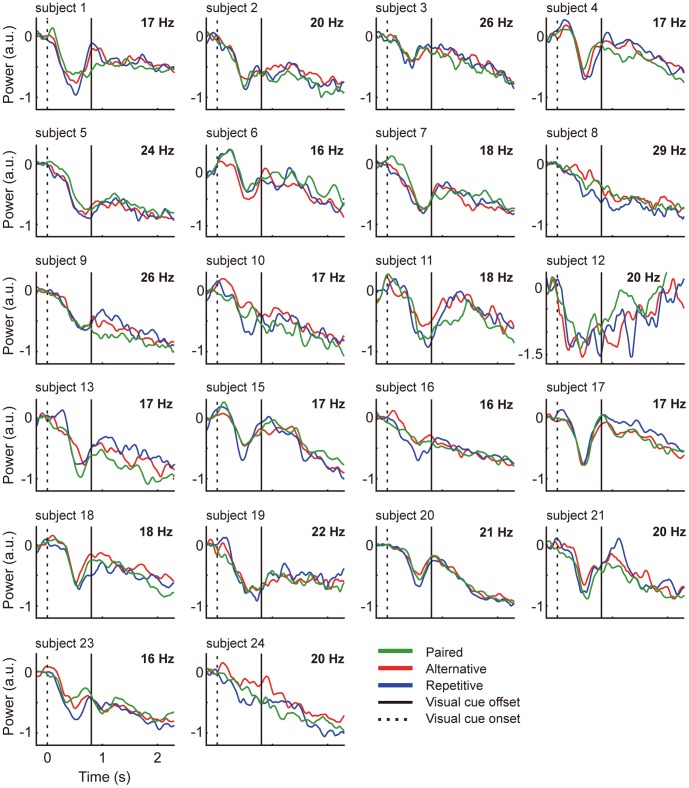
Figure 3. Beta-power time-course for 22 subjects.
Vertical axis is power (arbitrary units), horizontal axis is time (second). Green line is ‘Paired’ red line is ‘Alternative’ and blue line is ‘Repetitive’. The dotted and solid vertical lines depict zero (visual cue onset) and visual cue offset (0.8 s), respectively. The frequency of the power for each subject is indicated in the upper right corner of each plot.

