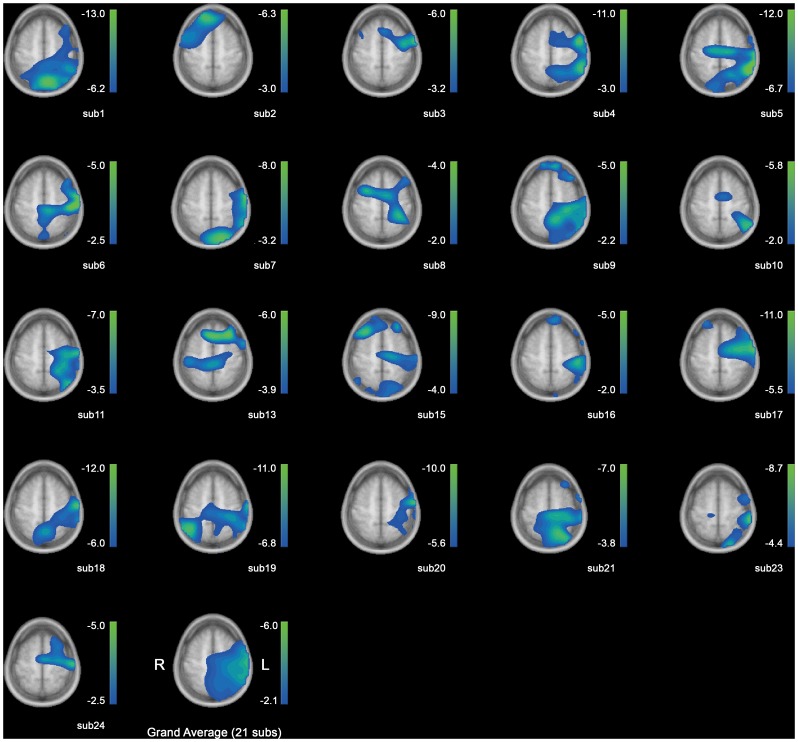
Figure 5. Source reconstruction for beta-ERD for 21 subjects.
From the upper left to right; subject 1 ∼ 5, in ascending order down to subject 24 in the bottom line, excluding subjects 12, 14 and 22. Grand average is on the last grid. The numbers in the scale bars indicate the amount of activity change from baseline in percent. Left is right and right is left.

