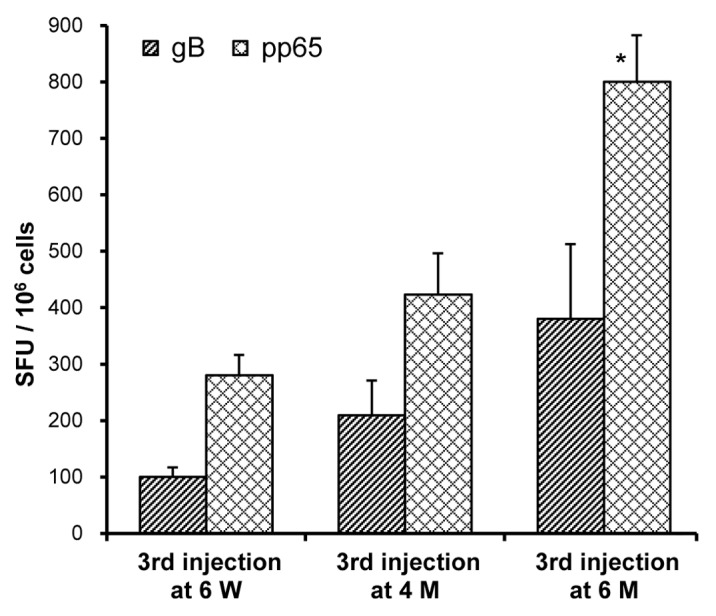
Figure 5. Effect of immunization regimen on T-cell responses in mice. On Day 0 and 21, mice (n = 5–6 per group) received IM injections with needle of a bivalent vaccine consisting of 2.5 µg of VR-6365 encoding gB and 2.5 µg of VR-6368 encoding pp65 formulated with Vaxfectin®. The third immunization was performed either on Day 42, i.e., at six weeks (6 W), on Day 126, i.e., at four months (4 M) or on Day 188, i.e., at six months (6 M). Three weeks after the third immunization, gB- (hatched bars) and pp65-specific (crosshatched bars) T-cell responses were measured using the IFN-γ ELISPOT assay. Data are presented as the number of antigen-specific IFN-γ producing T-cells, designated as spot forming units (SFU) per million splenocytes (SFU/106 cells). * Significantly different from groups which received the third immunization either at six weeks or at four months (p < 0.01).
