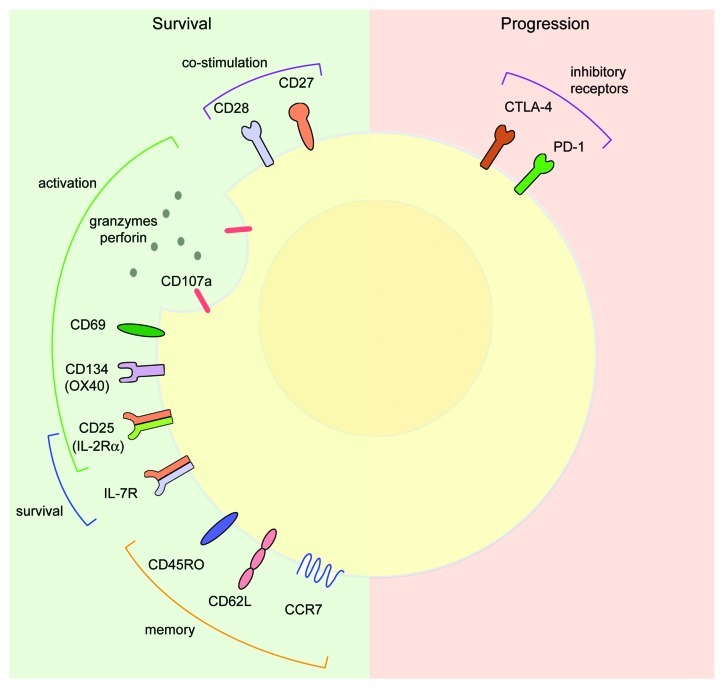
Figure 1. Cell surface phenotypes in melanoma. On the left (green): cell surface markers associated with melanoma survival. Co-stimulatory molecules: CD27 and CD28; activation markers: CD107a, CD69, CD134 (OX40) and CD25 (IL-2Rα); cytokine receptors that promote T-cell survival: CD25 (IL-2Rα) and IL-7R; memory T-cell markers: CD45RO, CD62L, and CCR7. On right (pink): cell surface markers associated with melanoma progression. Inhibitory receptors, CTLA-4 and PD-1.

An official website of the United States government
Here's how you know
Official websites use .gov
A
.gov website belongs to an official
government organization in the United States.
Secure .gov websites use HTTPS
A lock (
) or https:// means you've safely
connected to the .gov website. Share sensitive
information only on official, secure websites.
