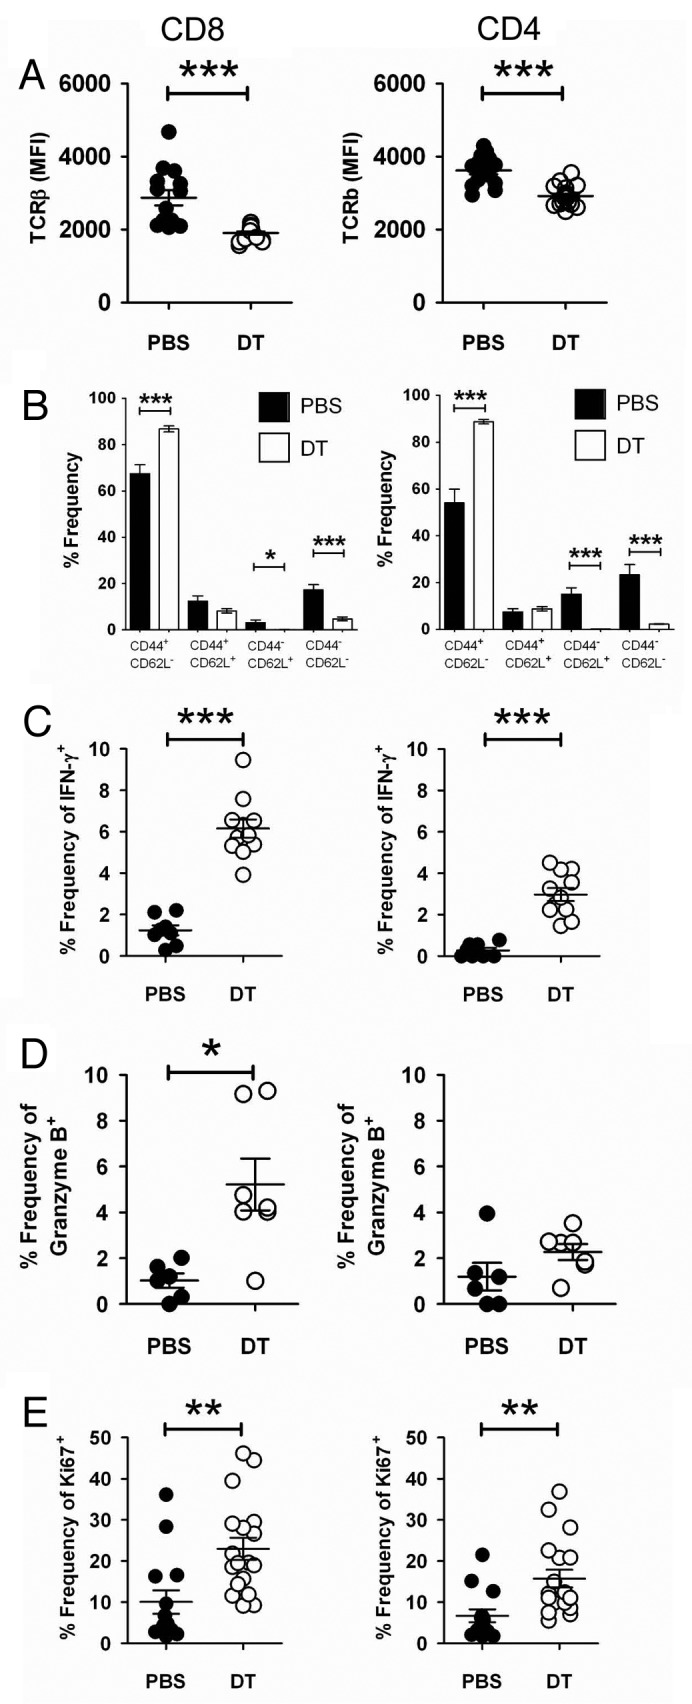
Figure 4. Foxp3+ Treg depletion enhances immune effector cell activation. (A–D) Groups of C57BL/6 DEREG mice (n = 4–11) were inoculated s.c. with 5 × 10⁴ B16F10 melanoma cells on day 0. On days -2, 5 and 12, mice were injected i.p. with either 500 ng diphtheria toxin A (DTA) or PBS. On day 18–20, tumors were excised and tumor-infiltrating leukocytes (TILs) were analyzed bv flow cytometry. Mean fluorescence intensity (MFI) of TCRβ gated on CD8+ [(A), left panel)] or CD4+ [(A), right panel)] B16F10 TILs from PBS- or DTA-treated mice. Each symbol represents a single mouse. Data shown are pooled from three independent analyses. Statistical differences between PBS- and DTA-treated mice were determined by unpaired Student’s t-tests (***p < 0.001). The frequency of the CD44+ and CD62L+ subsets of CD8+ [(B), left panel)] or CD4+ [(B), right panel)] B16F10 TILs from PBS- or DTA-treated mice is shown. Statistical differences between PBS and DTA-treated mice were determined by unpaired Student’s t-tests (*p < 0 0.05; ***p < 0.001). Frequencies of IFNγ+(C), granzyme B+(D) or Ki67+(E) cells, upon gating on CD8+ (left panel) or CD4+ (right panel) B16F10 TILs from PBS- or DTA-treated mice are shown. Each symbol represents an individual mouse. Data shown in (C) and (D) are from one independent analysis. Data shown in (E) are pooled from two independent analyses. Statistical differences between PBS- and DTA-treated mice were determined by an unpaired Student’s t-tests (*p < 0.05; **p < 0.01; ***p < 0.001).
