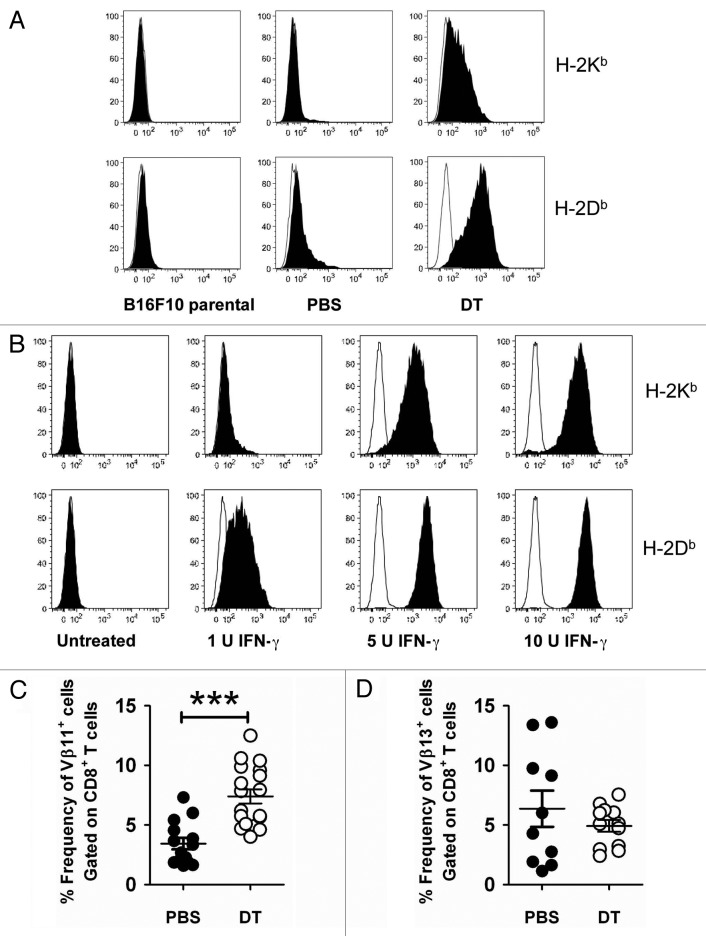
Figure 5. Modulation of surface immunogenicity of tumor cells by interferon γ. (A) Groups of C57BL/6 DEREG mice were inoculated s.c. with 5 × 10⁴ B16F10 melanoma cells on day 0. On days -2, 5, 12 and 19, mice were injected i.p. with either 500 ng diphtheria toxin A (DTA) or PBS. Tumors from each group were excised when tumor size exceeded 120 mm2, cell lines were generated and then stained for the expression of H-2Kb and H-2Db. Representative histograms are shown (PBS, n = 5 cell lines; DTA, n = 10 cell lines). (B) Parental B16F10 tumor cells were incubated with increasing doses of interferon γ (IFNγ) for 48 h in triplicate wells and then analyzed by flow cytometry for the expression of H-2Kb and H-2Db. Representative histogram plots are shown. (C and D) Groups of C57BL/6 DEREG mice (n = 4–7) were inoculated s.c. with 5 × 10⁴ B16F10 melanoma cells on day 0. On days -2, 5 and 12, mice were injected i.p. with either 500 ng diphtheria toxin A (DTA) or PBS. On day 18–20, tumors were excised and tumor-infiltrating leukocytes (TILs) were analyzed by flow cytometry. The frequency of Vβ11+(C) or Vβ13+(D) CD8+ B16F10 TILs from PBS- or DTA-treated mice is shown. Statistical differences between PBS- and DTA-treated mice were determined by unpaired Student’s t-tests (***p < 0.001). Each symbol represents an individual mouse. Data are pooled from three (C) or two (D) independent analyses.

An official website of the United States government
Here's how you know
Official websites use .gov
A
.gov website belongs to an official
government organization in the United States.
Secure .gov websites use HTTPS
A lock (
) or https:// means you've safely
connected to the .gov website. Share sensitive
information only on official, secure websites.
