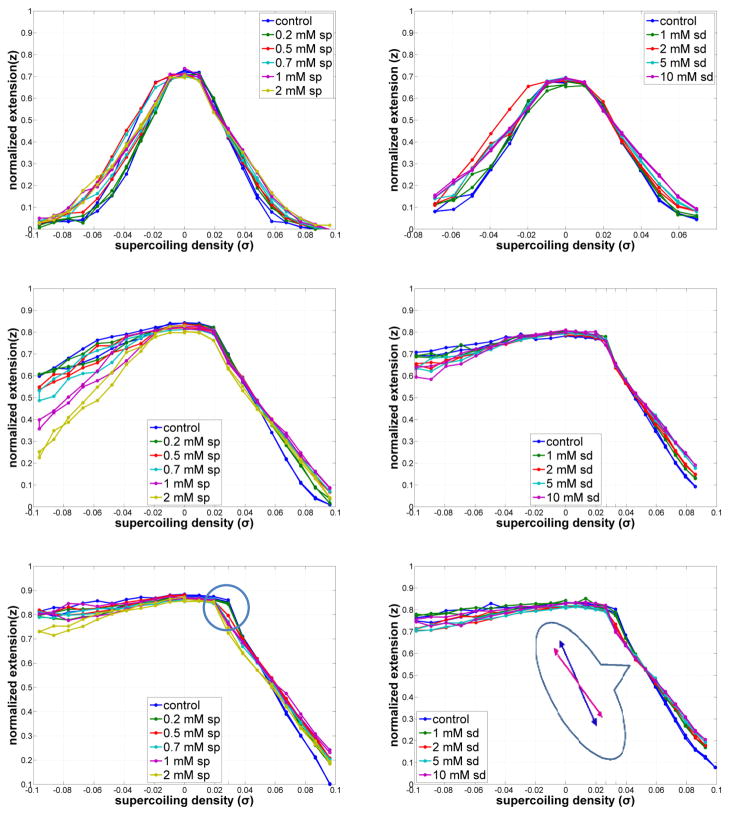
Figure 3.
DNA extension vs. supercoiling density as a function of spermine (left) or spermidine (right) concentrations at 0.2 (upper), 0.6 (middle), and 1 pN (lower) of tension. “Knee-points” are encircled. The inset emphasizes the change in slope due to added spermidine. Typical measurement errors are shown in supplementary information on a copy of the curves for 0.6 pN with added spermine.

