Fig. 7.

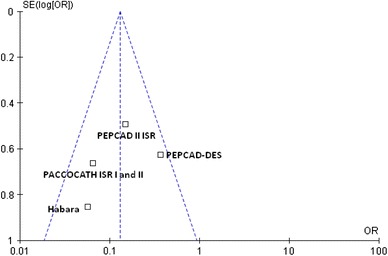
Funnel plot for the mortality outcome. The sample size of each study (measured as standard error of the treatment effect) was plotted against the odds ratio for overall mortality

Funnel plot for the mortality outcome. The sample size of each study (measured as standard error of the treatment effect) was plotted against the odds ratio for overall mortality