
Table 3.
Mean BMI by psychological distress and gender; NHIS (2004-2010)
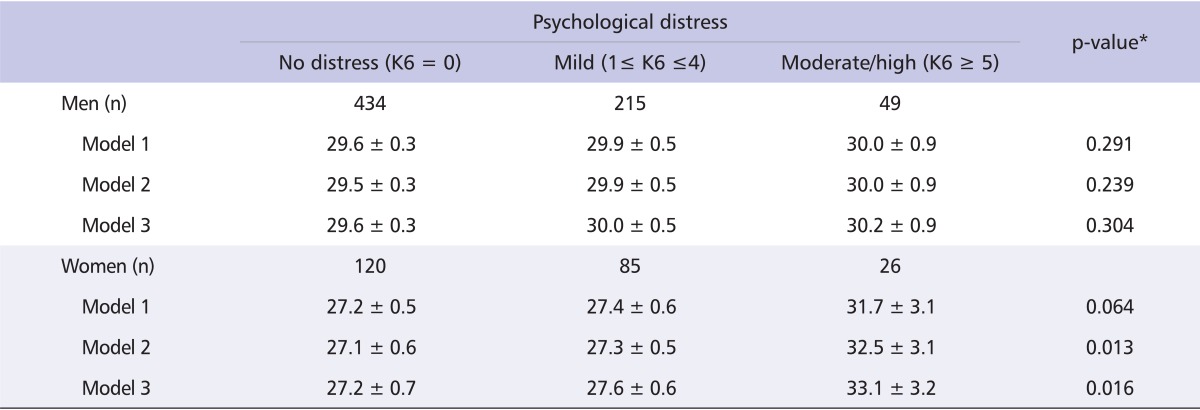
Values are presented as mean ± standard error.
Model 1: unadjusted; Model 2: adjusted for age, race/ethnicity; Model 3: adjusted for age, race/ethnicity, annual income, and education.
*The p-values are from linear regression.
Interaction p-value = 0.192 for psychological distress*gender.
BMI: body mass index, NHIS: National Health Interview Survey, K6: Kessler 6.