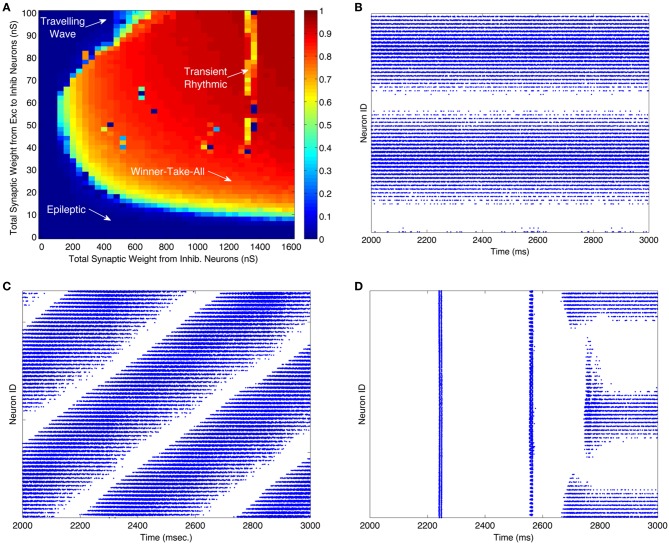
Figure 2.
WTA dynamics can occur in large regions of the parameter space of CAS networks. (A) A measure of winner-take-all behavior in a network is plotted as a function of synaptic weights coupling the excitatory and inhibitory neural populations. The measure we use is the highest firing rate of any neuron in the network, subject to a sparseness constraint that at least half of the neurons in the network are firing at less than 2 Hz; otherwise the measure is defined to be zero. The total synaptic conductance in nano-siemens (nS) (Izhikevich and Edelman, 2008) in each individual inhibitory neuron from excitatory neurons is on the y-axis, and total inhibitory conductance received by each neuron, excitatory or inhibitory, is on the x-axis. The orange and red areas indicate regions of the parameter space in which the network exhibits WTA behavior. The lower left region of the parameter space, labeled “Epileptic,” defines networks exhibiting epileptic dynamics in which all neurons fire indiscriminately to the stimulus. (B–D) Are raster plots which show all spikes (blue dots) during the third second of the simulation for each excitatory neuron in the network. (B) All spikes of a network in a WTA state at parameters labeled “Winner-Take-All” in (panel A). During this state some excitatory neurons (horizontal band of blue dots) fire persistently in response to a constant stimulus while others are silent. (C) At certain values of parameters, labeled “Traveling Wave” in (panel A), region of the parameter space, the network exhibits moving patches of activity instead of the stable patches shown in (B); this results in diagonal bands in the one-dimensional raster plot. (D) Occasionally the network requires more than two simulated seconds for a winner to emerge. These “Transient Rhythmic” states result in all neurons firing synchronously and rhythmically for some time before a winning group emerges. See Figures A1–A3 for close up plots from (panels B–D). A raster plot corresponding to the epileptic activity state is not shown.

