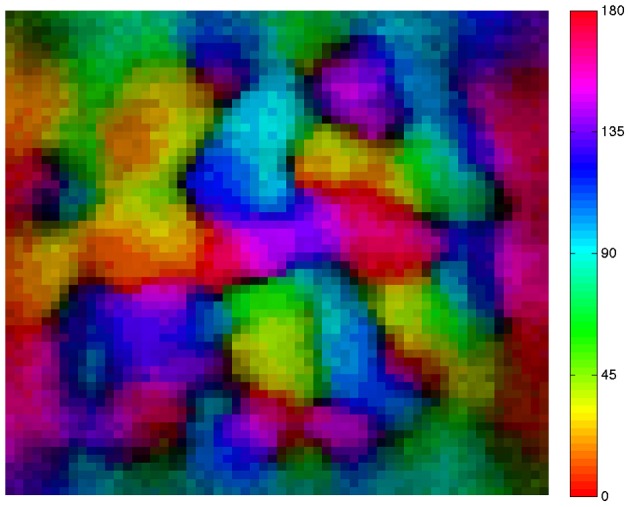
Figure 3.

A simulated neural network develops a smooth orientation map similar to those of cat and primate visual cortex. The map shows the preferred orientation of individual excitatory neurons arrayed in a 60 × 60 neuron grid. Pixel colors relate location of each neuron to its preferred orientation as indicated by the color bar at right of the map. Adjacent neurons in the network tend to have similar orientation preferences. Brightness varies with orientation selectivity (dark = low selectivity, bright = high selectivity); dark areas are found at the centers of so-called orientation pinwheels.
