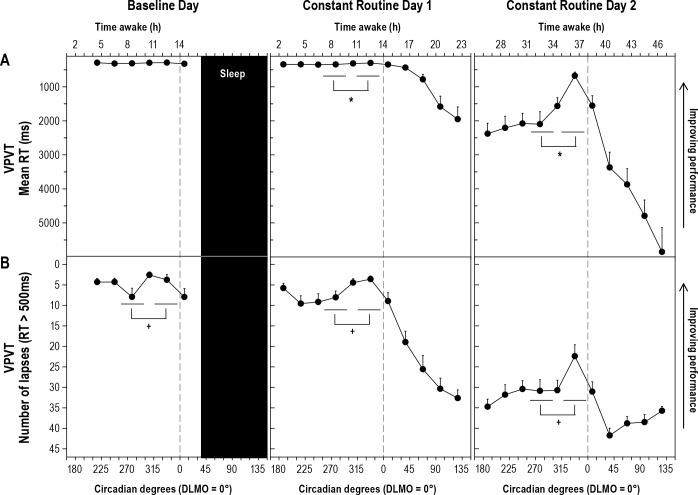
Figure 3. Visual Psychomotor Vigilance Task (VPVT) performance across three study days.
Performance on the visual psychomotor vigilance task (vPVT) at each time point relative to circadian phase plotted across baseline day and constant routine days 1 and 2. (A) vPVT mean reaction time (RT) in milliseconds; (B) Number of lapses on vPVT. Testing was carried out every 30°/∼120 minutes. For statistical analysis, data were assigned to 15° “bins” and the mean of all available trials occurring within each 45°/∼3-h WMZ or DAY block was then included. See legend of Figure 2 for additional information. *Post hoc analysis of Study day × Block interaction for vPVT mean RT. Constant Routine Day 1: p = 0.008, Partial h2 = 0.23. Constant Routine Day 2: p = 0.005, Partial h2 = 0.26. +Main effect of Block comparison, without interaction effect, p < 0.0001, Partial h2 = 0.49.

