
Fig. 5.
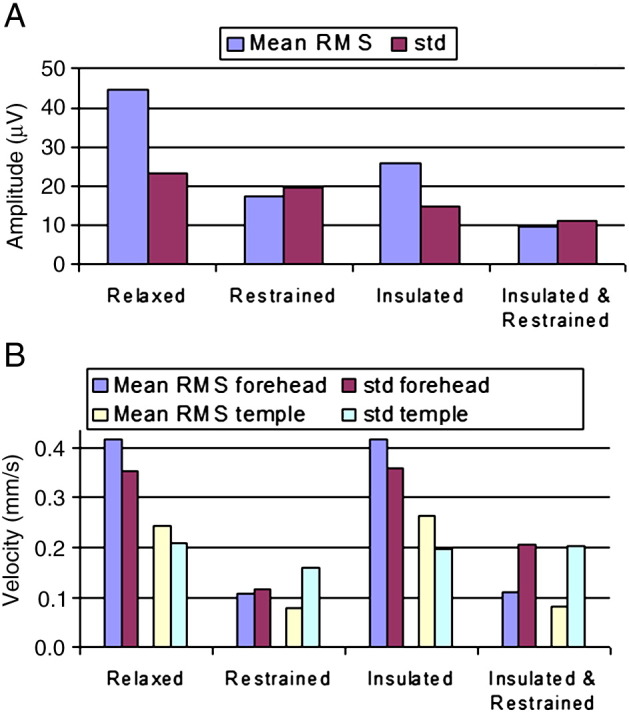
The RMS and standard deviation in each condition averaged over subjects and cardiac cycle for: A) the EEG artefact; and B) and head motion (also see Supplementary Table).
The RMS and standard deviation in each condition averaged over subjects and cardiac cycle for: A) the EEG artefact; and B) and head motion (also see Supplementary Table).