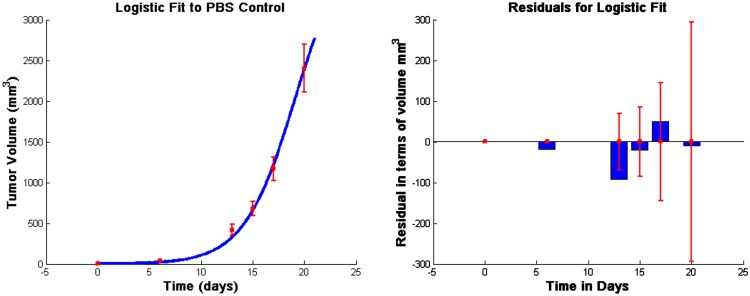
Figure 1.
Fits to data from Lee et al. (2007) and corresponding residuals. The vertical bars in the graph on the left are the error bars from the experimental data, and the solid line is the outcome of the model simulation using the parameters that minimize the distance to the median of those data. In the graph on the right, the thin vertical bars are the same error bars from the data, and the solid rectangles show the “residuals,” that is, the distances between the simulated outcomes and the data. The estimated parameter values are given in Table A1 in Appendix.

