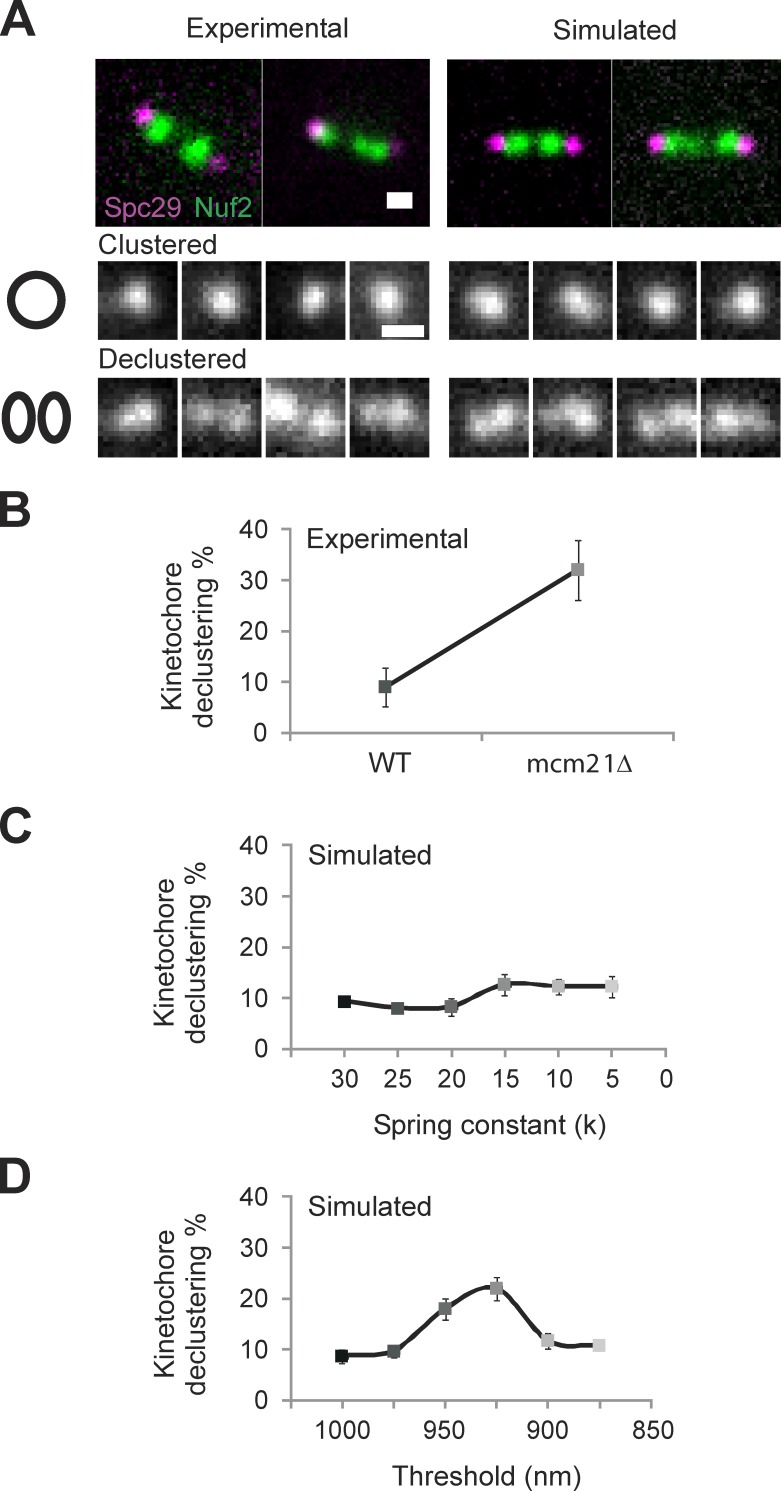
Figure 4.
Experimental kinetochore declustering is predicted by simulations with a piecewise continuous chromatin spring (CNLS) but not a linear spring (CLS). (A) Experimental and simulated images of WT and mcm21Δ cells with Spc29-RFP (spindle poles) and Nuf2 or Ndc80-GFP (kinetochores) were scored as clustered (kinetochore focus) or declustered in cells having the focus of 16 kinetochores split into multiple foci. Example experimental (left) and simulated (right) images showing a bundle of clustered (middle) and declustered (bottom). (B) Experimental declustering in WT and mcm21Δ cells (WT: 9 ± 4%, n = 209, two experiments; mcm21Δ: 32 ± 6%, n = 230, two experiments). (C and D) Model simulations were used to generate images that match the physical geometry of the mitotic spindle (model convolution; Quammen et al., 2008; Gardner et al., 2010). The position of the spindle poles and plus end of each kMT were convolved with the point-spread function of our microscope objective to produce a simulated image of spindle poles and clusters of kinetochore proteins at the microtubule plus ends. Declustering was scored using the same criteria as in experimental images (n = 300, three groups of 100). (C) Decreasing the linear spring constant by an order of magnitude results in an insignificant increase (9–12%, χ2 > 0.30) in kinetochore declustering. (D) Decreasing the threshold of a piecewise continuous spring results in a significant increase in declustering (10–22%, χ2 < 1 × 10⁻⁴) comparable to experimental (B vs. D). Bars, 0.5 µm. Error bars represent standard deviation.

