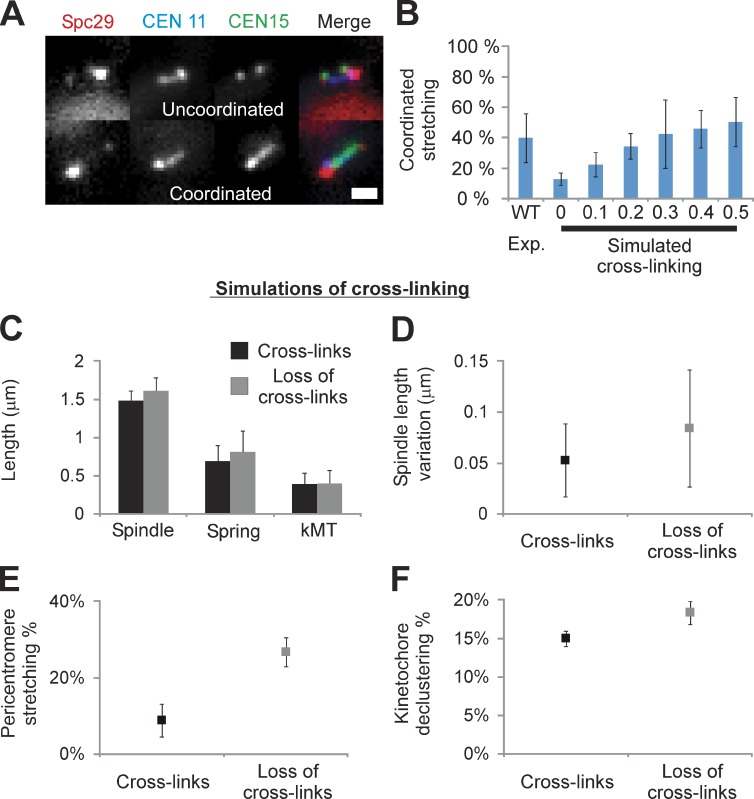
Figure 5.
Observed coordinated stretching is predicted in simulations with cross-links between adjacent chromatin springs. Cells were labeled with Spc29-RFP (spindle poles), TetO/TetR-CFP at 0.4 kb from CEN11, and LacO/LacI-GFP 1.8 kb from CEN15. WT cells exhibit stretching of a single pericentromere LacO in 11% of cells (Stephens et al., 2011) and recapitulated herein (12 ± 3%, n = 261). (A) Cells with two labeled arrays (CEN11 and CEN15) exhibit one stretching (uncoordinated, top) or both stretching (coordinated, bottom; WT: 40 ± 16%, n = 45 stretching cells). (B) Coordinated stretching was measured in simulations of a piecewise continuous spring, in which asymmetric stretching can be predicted (Fig. 2 C). Chromatin springs were cross-linked with a Hookean spring of increasing strength relative to the chromatin spring constant (0–0.5× = 0–15 pN vs. chromatin spring constant of 30 pN, n = 500, five experiments [Exp.] of 100). For each cross-linking spring constant, the threshold was altered to obtain 12 ± 2% stretching if a single pericentromere was labeled (experimental WT single stretching percentage). Population simulations were then measured for coordinated stretching of any pair of springs. In the absence of cross-linking (0, Simulated) the predicted frequency of coordinated stretching is 13 ± 4%, less than observed experimentally (left, WT). Cross-linking springs with 0.3× the spring constant of the chromatin spring best match experimental (P = 0.88, 42 ± 22%, right; vs. WT 40 ± 16%, left). (C–F) Loss of cross-linking (0 kcross-link; 955 nm Lthreshold) displays increased spindle length (C), spindle variation (D), pericentromere stretching (E), and kinetochore declustering (F; P < 0.05). Bar, 1 µm. Error bars represent standard deviation.

