
Figure 4. Comparing k-shell decomposition and core-periphery analysis.
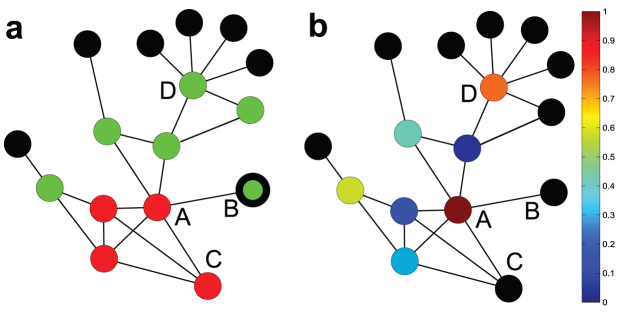
(a). k-shell decomposition: black, green, and red nodes compose, respectively, the 1-, 2, and 3-shell. Node B is in the 1-shell (black) if weights are ignored, in the 2-shell (green) otherwise (see text). (b). Core-periphery profile: nodes are coloured according to their coreness (setting wAB = 1 or 3 yields negligible variations): p-nodes (αk = 0) are in black.