
Figure 6. Comparing σ- and α-ranking in the world trade network.
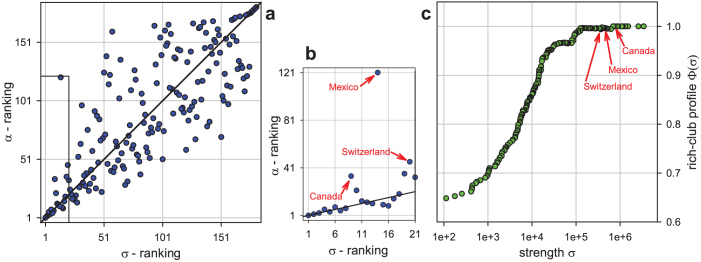
(a). Each node (i.e., country) is represented by a dot whose coordinates are its position in the σ-ranking (i.e., total trade volume) and α-ranking (i.e., coreness). Note that top-ranking nodes are in the lower-left corner (lowest rank values). (b). Zooming into the top 20 countries of the σ-ranking. (c). Rich-club profile of the world trade network: each node (i.e., country) is represented by a dot whose coordinates are its strength σ (i.e., total trade volume) and the corresponding value Φ(σ) of the rich-club coefficient.