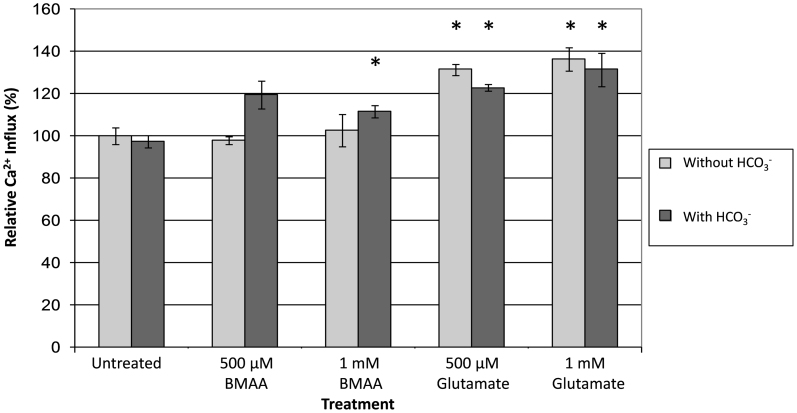
Figure 2. Ca2+ influx in OECs.
Ca2+ influx of OECs treated with BMAA or glutamate. Fluorescence of fura-2-am was read (ex: 485 nm, em: 520 nm) immediately after addition of treatment conditions. *P < 0.05 compared to control. ˆP < 0.05 compared to same treatment without HCO3−. Error bars represent SEM, n = 3.

