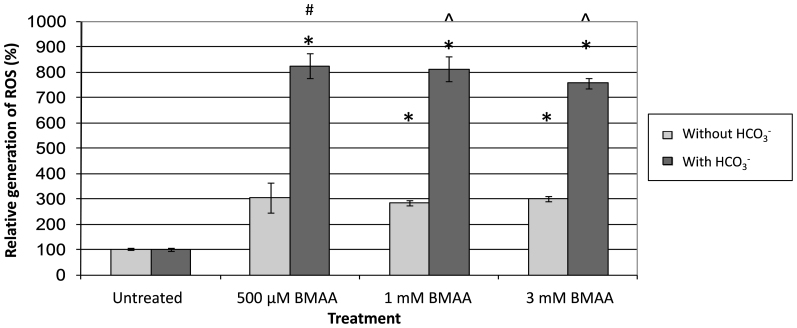
Figure 3. Generation of ROS in OECs.
Generation of ROS in OECs treated with BMAA, with and without HCO3−. Fluorescence of DCFDA was read (ex: 485 nm, em: 535 nm) at 0 (background) and 60 min after addition of treatments. *P < 0.005 compared to the untreated control. #P < 0.003 compared to same sample without HCO3−. ˆP < 0.001 compared to same sample without HCO3−. Error bars represent SEM, n = 3.

