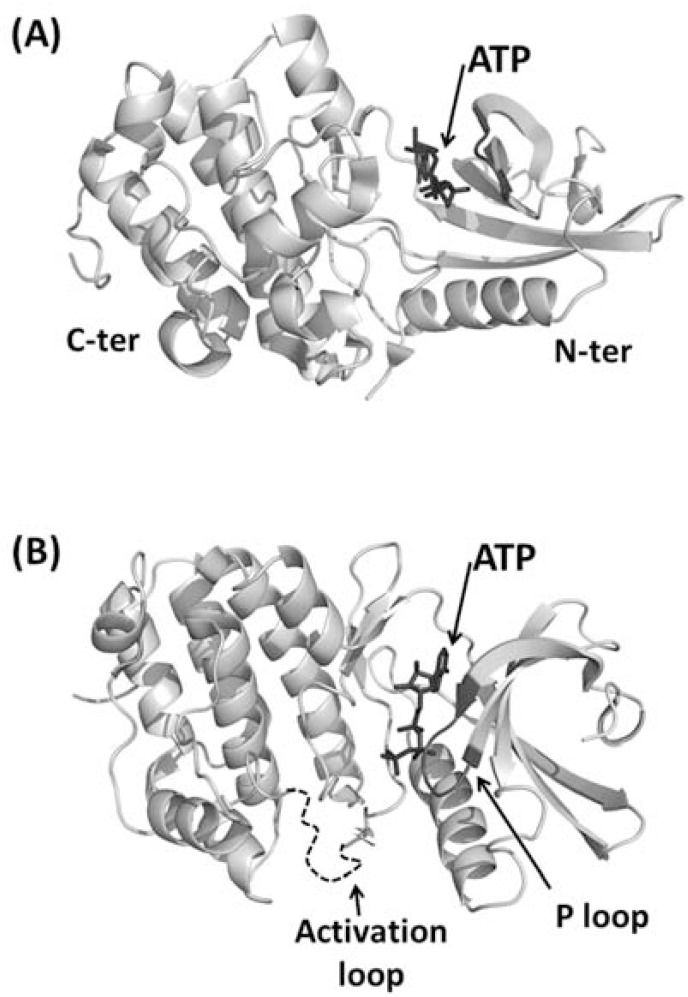
Fig. (3).
Cartoon representation of the kinase domain from PknB of M. tuberculosis. (A) Side view. N-terminal and C-terminal lobes are indicated with N-ter and C-ter, respectively. ATP is represented in ball-and-stick and indicated by an arrow. (B) Top view. The P loop is represented in black whereas the activation loop, which is disordered in the crystal structures, is represented as a dashed curve.

