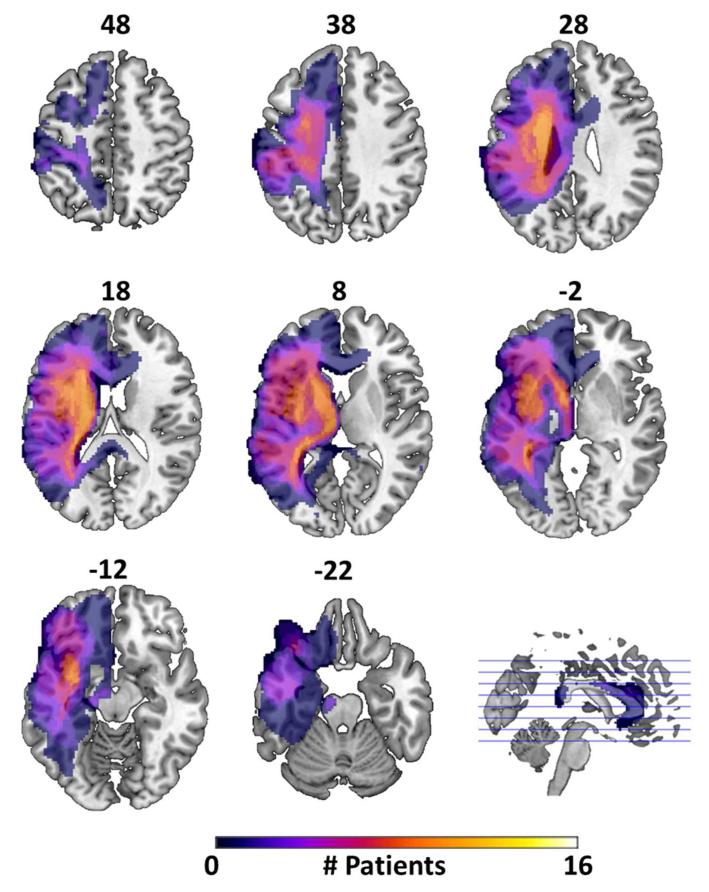
Figure 1. Lesion Frequency Map.
Axial slices showing extent and variability of lesion location within the patient group, as defined by the automated lesion detection method of Stamatakis & Tyler (2005). Numbers above each slice give its z coordinate in MNI space. Colour bar indicates number of patients whose lesions fell within that region.

