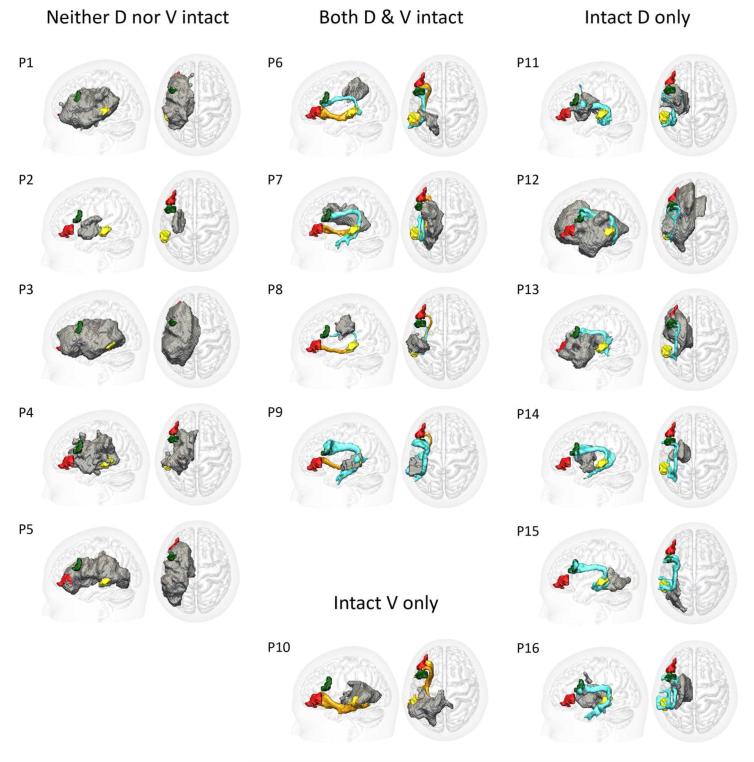
Figure 4. Patients’ Tracts.
Surface renderings of individual tractography reconstructions in the left hemisphere for each of the 16 patients. Grey regions indicate the outer surface of the lesioned tissue, as defined by the automated lesion detection method of Stamatakis & Tyler (2005).

