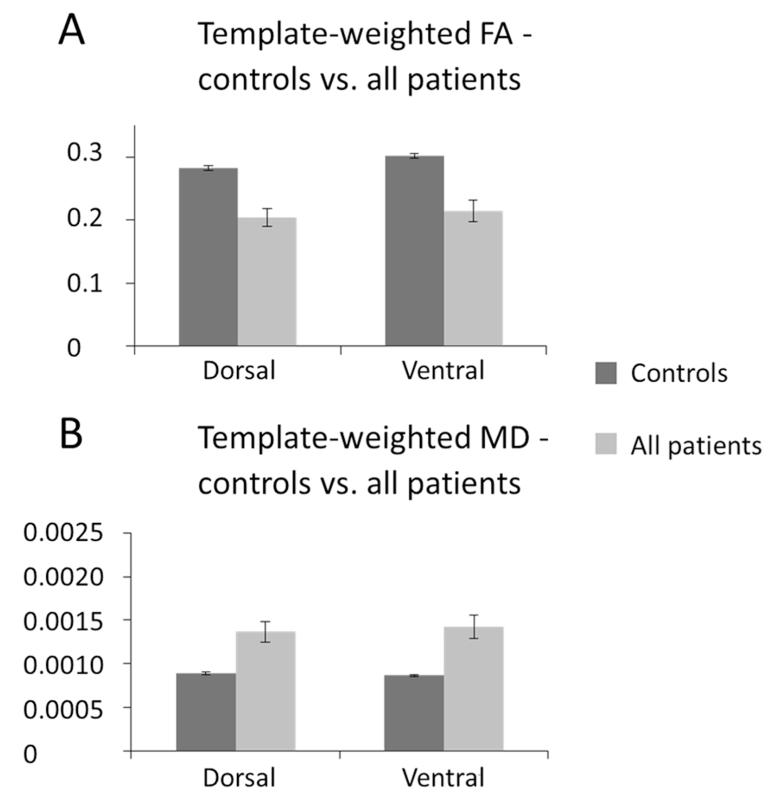
Figure 5. Tract Template Analyses – controls vs. all patients.
Mean FA (A) and MD (B) values weighted by tract probability, extracted from dorsal pMTG←→BA44 (AF) and ventral pMTG←→BA45 (EmC) pathway templates following the method of Hua et al. (2008). Controls show significantly higher FA and lower MD than patients within both the AF and EmC template.

