
Fig. 4.
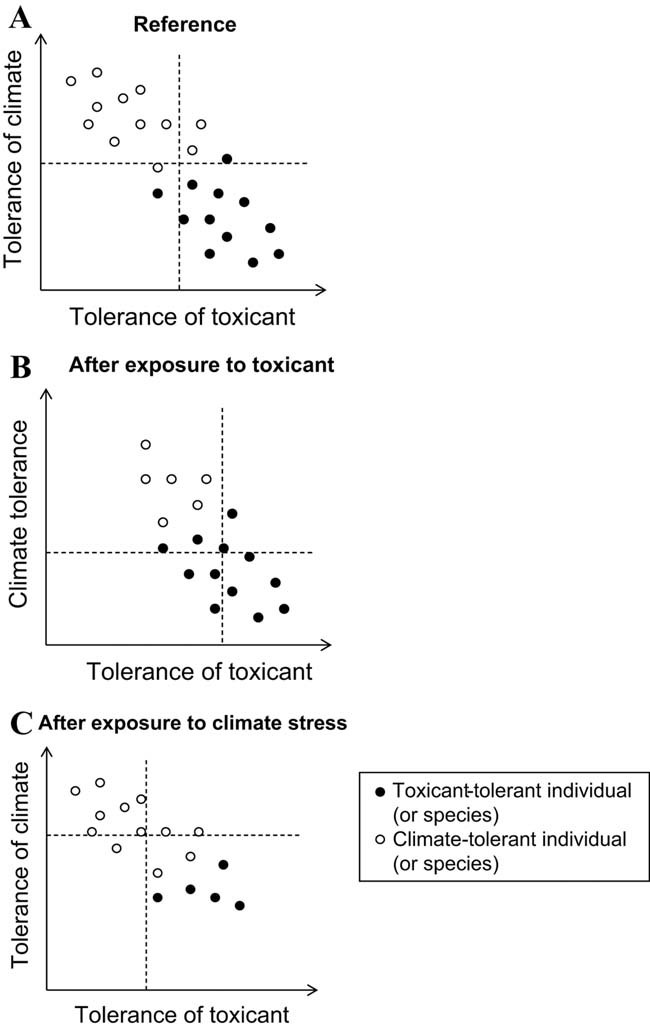
Simplified visualization of the cost of tolerance concept. (A) The points represent individuals within a population. Individual differences in genetic makeup result in variable tolerance of climate (i.e., a stressor related to GCC) and tolerance of a toxicant. A genetic trade-off between the two types of tolerance exists within the population. Individuals can therefore be categorized as either climate-tolerant or toxicant-tolerant. The dashed lines represent the population average for these two traits. (B) Following toxicant exposure over multiple generations, natural selection will favor the more toxicant-tolerant individuals; therefore, the population's average tolerance of the toxicant will increase. The average tolerance of climate will consequently decrease. In addition, the overall genetic diversity will decrease for both traits. (For simplicity, the recruitment of new individuals is not included in the illustration.) (C) Conversely, during long-term climatic stress, natural selection may favor the more climate-tolerant individuals and thereby reduce the average toxicant tolerance of the population (as well as genetic diversity). The cost of tolerance concept can also be applied to the community level; the points then represent different species within a community.