
Fig. 3.
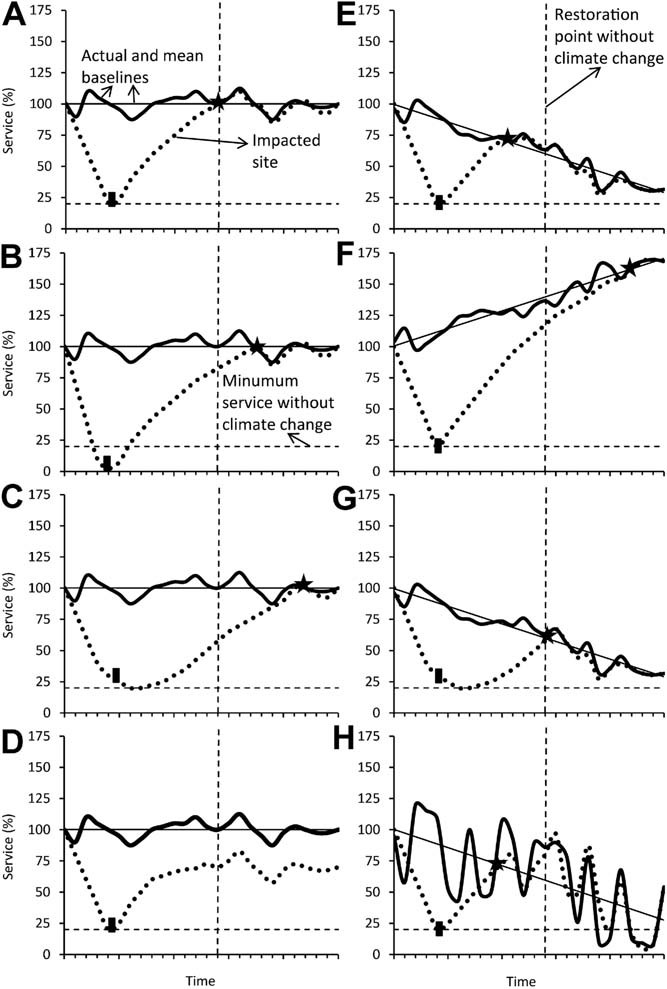
Baseline and primary restoration scenarios without (A) and with (B–H) global climate change. In each scenario, the hazardous substance release occurs at time zero at the impacted site (dotted line). The rectangle depicts the time at which release of the chemical is ceased and restoration begins (natural or facilitated). The star indicates the point of full recovery/restoration, where the impacted site returns to the baseline condition (mean baseline, thin solid black line; actual baseline, thick solid black line). Thin, dashed, horizontal lines represent the minimum postdamage service in the absence of climate change; thin, dashed, vertical line represents the restoration point in the absence of climate change. Climate change can delay recovery/restoration (star) by additively or synergistically interacting with hazardous substances such that the initial rate of decline of services is greater (B) or the rate of recovery is less (C) than in the absence of climate change. Climate change might also prevent services from ever returning to preinjury baseline conditions (D). Baseline services could also decrease (E) or increase (F) with climate change, which can accelerate or delay recovery/restoration, respectively. Additionally, there can be combinations of the aforementioned effects that can affect injury assessment and restoration planning, such as climate change–induced decreases in baseline services and rates of recovery/restoration (G) or climate change–induced decreases in baseline services and increases in baseline variability that can make it more challenging to assess injury and restoration (H). For simplicity, stochastic variability in the contaminated site is not shown until it returns to the baseline condition. This is not meant to be a comprehensive coverage of the potential primary restoration scenarios with and without climate change.