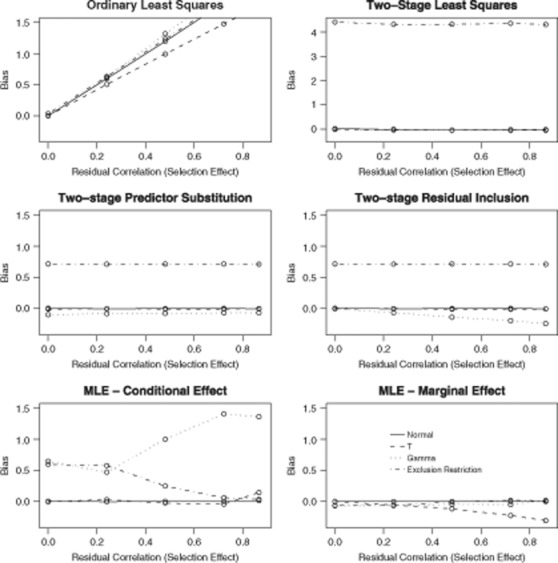
Figure 3.

Simulated bias of estimators as a function of ρ for different outcome distributions and status of the exclusion restriction. As per the Florida Medicaid analysis β1 = − 0.793, θ1 = 0.144, and if the exclusion restriction is violated then β3 = 0.144. The vertical axis in the upper-right plot covers a wider range to accommodate the excessive bias of 2SLS under violation of the exclusion restriction.
