Fig. 4.

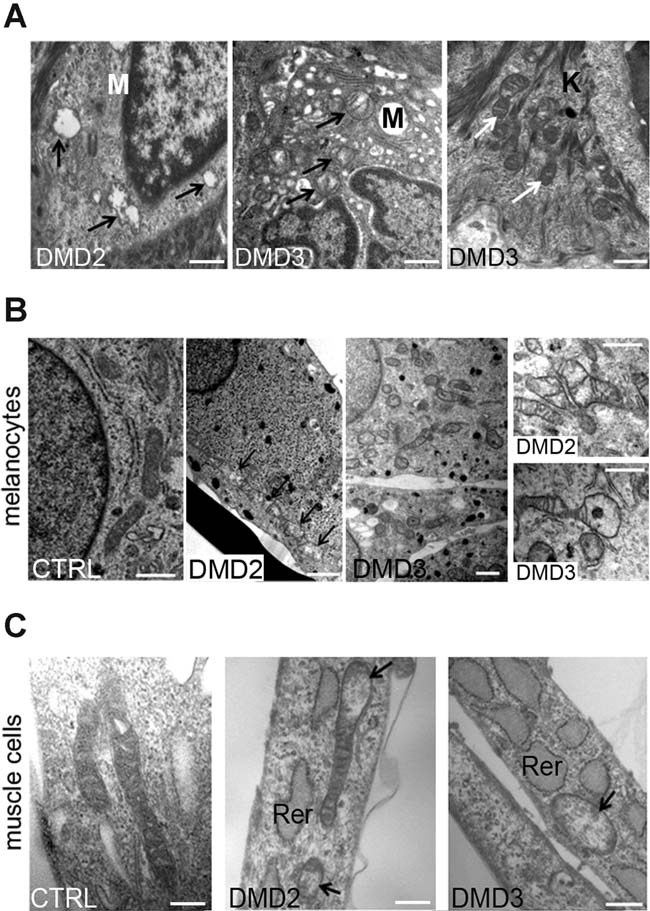
Morphological alterations of DMD mitochondria. A: Transmission electron microscopy analysis of DMD melanocytes (M) in skin sections show mitochondrial changes, such as increased size, reduced matrix density and disrupted cristae, (black arrows). On the contrary, mitochondria appears normal (white arrows) in DMD keratinocytes (K). B: Ultrastructural analysis of normal and DMD melanocytes. Normal melanocytes (CTRL) display elongated mitochondria with well-preserved cristae and dense matrix. Mitochondria of patients DMD2 and DMD3 appear enlarged with reduced matrix density and swelling (arrows). Bar, 600 nm. C: Ultrastructural analysis of normal and DMD myoblasts. Normal myoblasts (CTRL) show long mitochondria with a regular short axis. DMD2 and DMD3 cultured myoblasts show reduced matrix density and swelling (arrows). Rer, rough endoplasmic reticulum. Bar, 600 nm.
