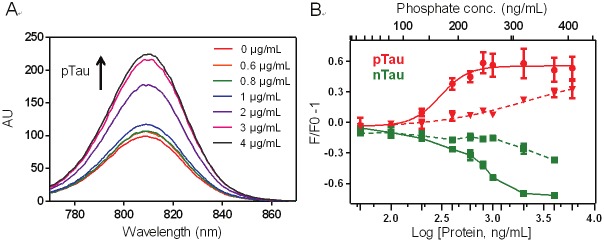
Figure 5.

Fluorescence titrations of CyDPA2 (5 μM) and CyDPA1 (15 μM) in 50 mM HEPES containing 10% DMSO (pH 7.4). (A) Fluorescence spectral changes of CyDPA2 in pTau bindings (pTau: 0, 0.6, 0.8, 1, 2, 3, 4 μg/mL). (B) Fluorescence binding assay of CyDPA2 (solid line) and CyDPA1 (dashed line) with pTau (red) and nTau (green); 0, 0.05, 0.1, 0.2, 0.4, 0.6, 0.8, 1, 2, 4, 6, 12 μg/mL of n,pTau. Error bars represent s.d. of triplicates.
