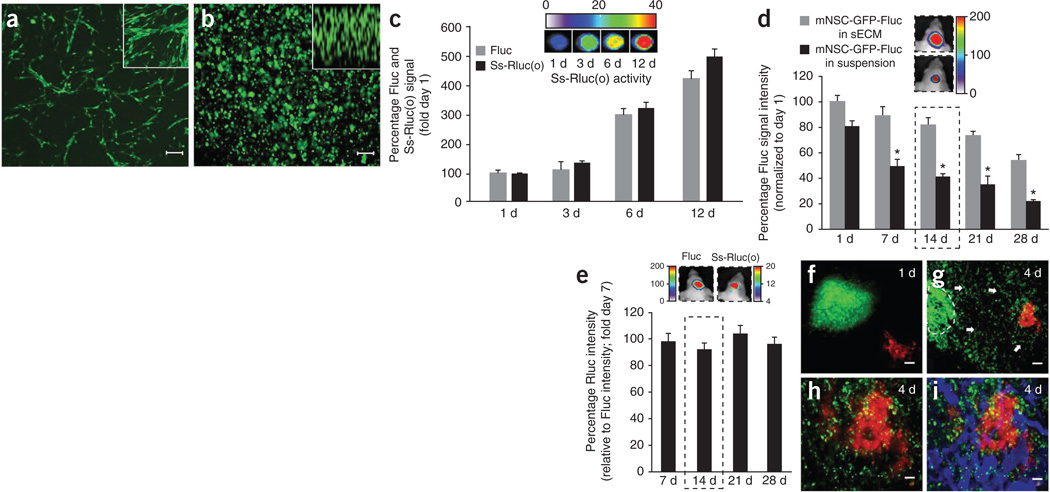
Figure 2. Characterizing engineered mNSCs in biocompatible sECM in vitro and in vivo.
(a,b) Photomicrographs of mNSCs expressing GFP-Fluc grown in monolayers, with higher magnification in inset (a) and encapsulated in sECM, with z-stack in inset (b). (c) Plot of cell proliferation and protein secretion and representative Rluc images for mNSCs coexpressing GFP-Fluc and Ss-Rluc(o), encapsulated in sECM and followed by simultaneous Fluc and Rluc imaging of cells and culture medium, respectively. (d) mNSC-GFP-Fluc cell survival in the brain over a period of 4 weeks when implanted in sECM versus in suspension. Mice were imaged serially for mNSC survival by Fluc activity. Representative images from day 14 mice (dashed outline) are shown. *P < 0.05 versus unencapsulated mNSCs. (e) Ratio of Rluc signal intensity relative to Fluc signal intensity. mNSCs expressing GFP-Fluc plus Ss-Rluc(o) were encapsulated in sECM and implanted intracranially, and cell viability (Fluc signal) and protein secretion (Rluc signal) were followed by simultaneous Fluc and Rluc imaging in vivo. Representative images from day 14 mice (dashed outline) are shown. (f–i) IVM images showing mNSCs (green) and tumor cells (red) on day 1 (f) and day 4 (g–i) after mNSC implantation. Mice bearing U87-mCherry-Fluc GBMs in the cranial windows were implanted with mNSC-GFP-Rluc cells encapsulated in sECM, 1 mm away from the established tumor. Dashed line, encapsulated mNSCs; arrows, mNSC migration in g; blue in i, tumor vasculature. Scale bars: 100 µm (a,b,h,i) and 200 µm (f,g). Original magnifications: ×20 (a,b insets). Data are mean ± s.e.m.

