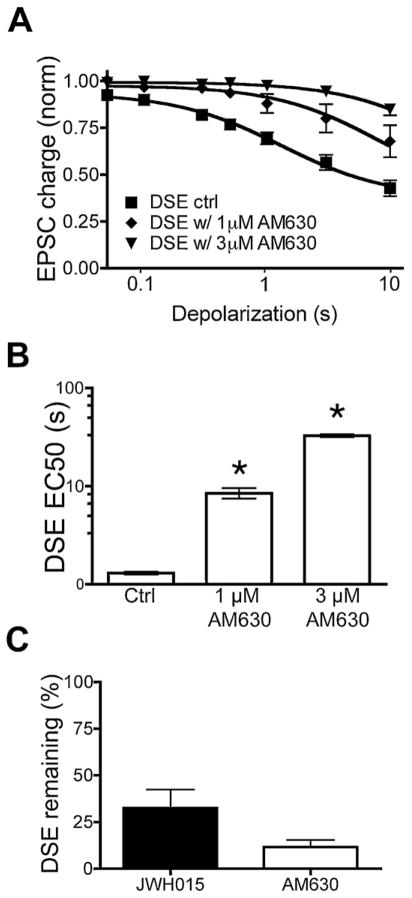
Fig. 4.
AM630 attenuates and JWH015 occludes DSE. (A) Depolarization–response curve shows relative EPSC inhibition with increasing durations of depolarization, under control conditions and following AM630-treatment [1 μM] and [3 μM] in wild-type neurons. There is statistically significant difference between each treatment and the control at time points of 500 ms (except for 1 μM), 1 s, 3 s and 10 s. (B) Bar graph shows that AM630 increases the duration of depolarization required for a half maximal response. The treatments differ significantly from control. (C) Bar graph shows percent DSE from a 3 s stimulus that remains after treatment with JWH015 [2 μM] or AM630 [3 μM].

