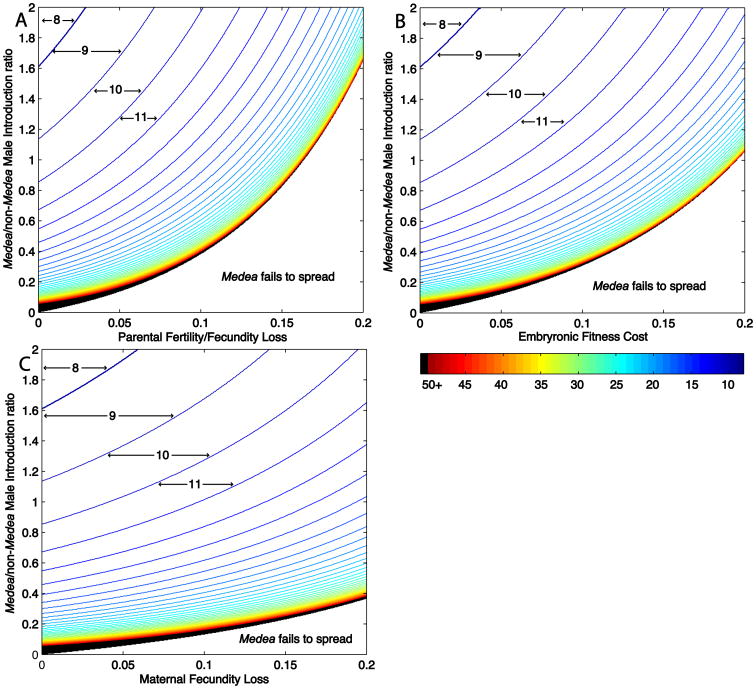
Figure 3.
When an autosomal Medea with a fitness cost and t1=0 spreads, it drives the elimination of non-Medea individuals, but not non-Medea alleles, from the population. (A) Plot describing the number of generations required for Medea to be present in 99% of individuals, for a Medea element with a parental fertility/fecundity cost. Homozygous Medea male:non-Medea male introduction ratios are indicated on the Y-axis, and parental fertility/fecundity cost on the X axis. Area between lines indicates regions of parameter space within which a specific number of generations (indicated by numbers and arrows) are required for the frequency of Medea individuals to reach 99% or greater. Line color, shown in the heat map in the lower right, provides a measure of how many generations are required. Black lines (50+) indicate that fifty or more generations are required. The border between the black-lined region and the lower unlined region defines the critical male introduction ratio (CMIR). (B) Plot describing the number of generations required for Medea to be present in 99% of individuals, for a Medea element with an embryonic fitness cost. (C) Plot describing the number of generations required for Medea to be present in 99% of individuals, for a Medea element with a maternal fecundity cost.

