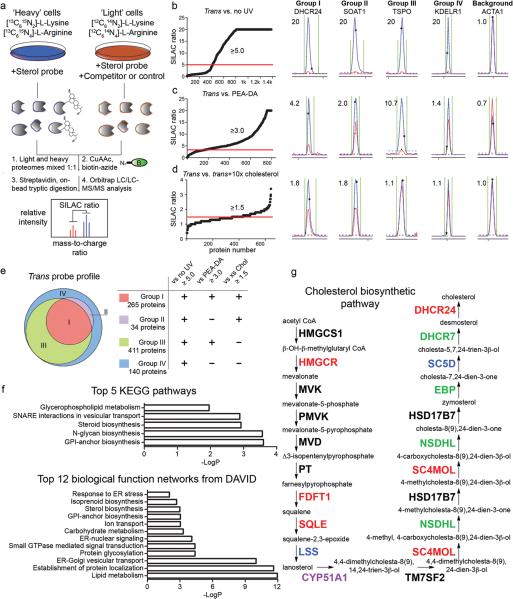
Figure 3. MS-based profiling of sterol-binding proteins in HeLa cells.
(a) Scheme for enrichment and analysis of sterol probe labeling profiles in mammalian cells by biotin-streptavidin methods and SILAC MS analysis. (b–d) Heavy/light ratio plots for total proteins identified in experiments that compared the labeling profiles of the trans-sterol probe versus no-UV light control (b; 20 μM trans probe / 20 μM trans probe with no UV), the PEA-DA probe (c; 20 μM trans probe / 20 μM PEA-DA probe), and 10× cholesterol competition (d; 10 μM trans probe / 10 μM trans probe + 100 μM cholesterol). Representative MS1 traces with calculated ratios for proteins that fall into Groups I-IV, as well as the MS1 traces for a non-specific background protein, are shown to the right of the global ratio plots. Ratios of > 20 are listed as 20. (e) Venn diagram showing the distribution of Group I-IV proteins for the trans-sterol probe labeling profile. (f) Top-five pathways determined by searching Group I proteins on the KEGG database, and top-12 biological function networks determined by searching Group I proteins on the DAVID gene ontology server. (g) Trans-sterol probe labeling profile for the cholesterol biosynthetic pathway, with colors reflecting each enzyme's Group designation (black: not detected).

