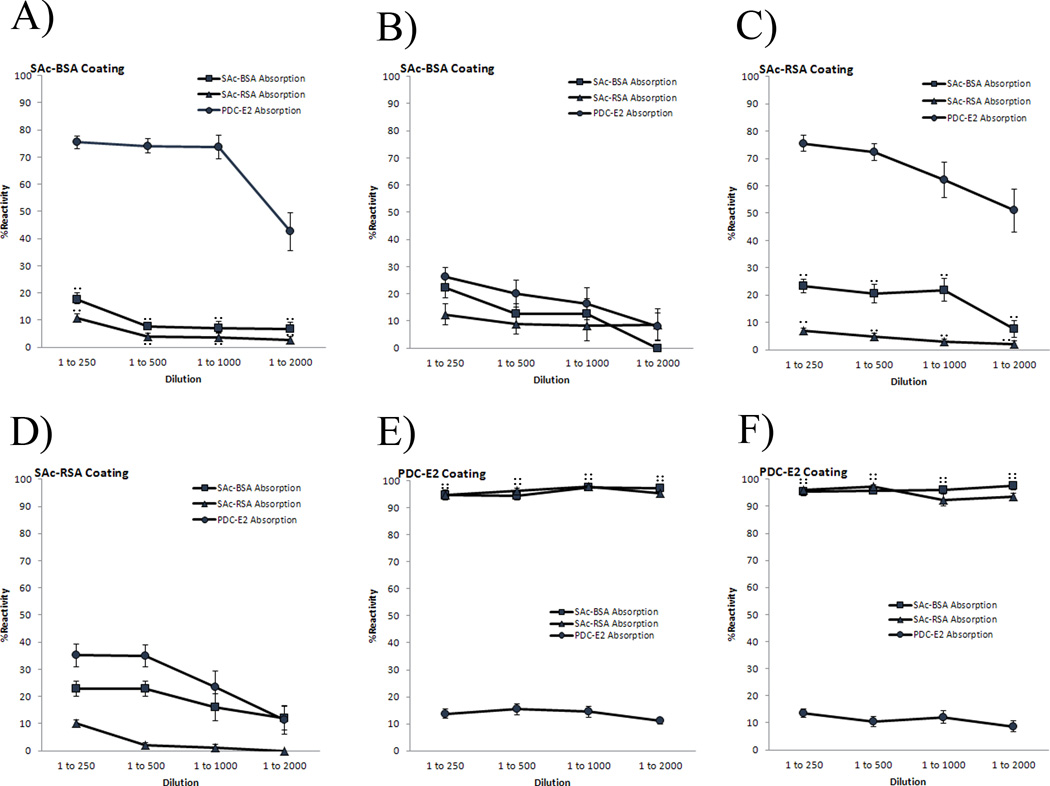
Figure 3.
IgG, IgM and IgA reactivity of AMA-positive PBC serum samples against SAc-BSA (A,B), SAc-RSA (C,D), and rPDC-E2 (E,F). 1st population (n=14) of AMA-positive PBC patients is represented in graphs A, C, and E; 2nd population (n=10) of AMA-positive PBC patients is shown in graphs B, D, and F. After absorption with SAc-BSA, SAc-RSA, rPDC-E2, BSA and Met e 1, reactivity is determined by ELISA at 1:250, 1:500, 1:1000, and 1:2000 serum dilutions. Note that 1st population (A,C) binds rPDC-E2 independently of SAc-conjugated proteins (p < 0.001). 2nd population (B,D) is cross-reactive between rPDC-E2 and SAc-conjugated proteins. Both 1st and 2nd populations retain their Ig reactivity against rPDC-E2 when absorbed with SAc-conjugated proteins (E,F). Both populations retain their reactivities to SAc-BSA, SAc-RSA, rPDC-E2 when absorbed with either BSA or Met e 1 (A–F). Data presented as mean ± SEM. Asterisks indicate significant differences of SAc-BSA absorption as compared to PDC-E2 absorption (**, p < 0.001; two-tailed unpaired t-test with Welch’s correction). Number signs indicate significant differences of SAc-RSA absorption compared to PDC-E2 absorption (##, p < 0.001; two-tailed unpaired t-test with Welch’s correction).

