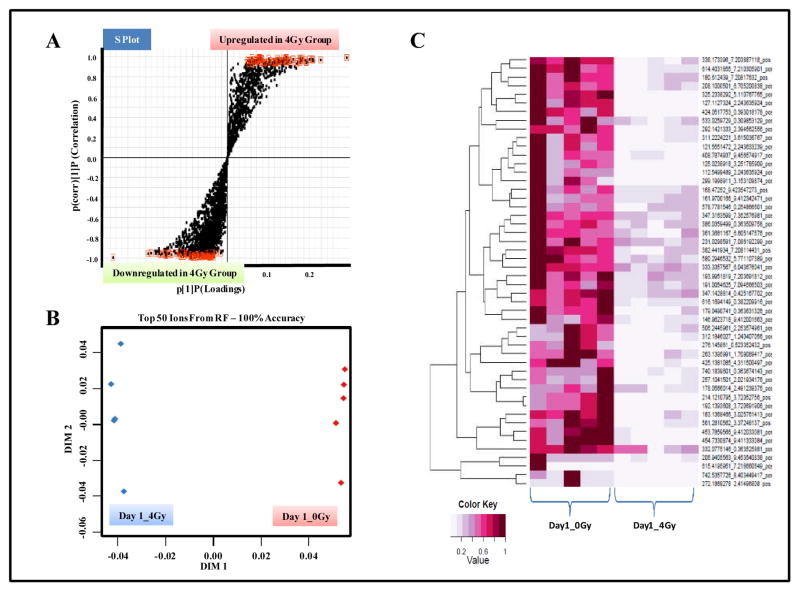
Figure 2. UPLC-ESI-TOFMS profiling of GI tissue in CD2F1 mice.
Animals were either sham irradiated or exposed to 4Gy of γ radiation. The mice were euthanized 1 day, post-IR exposure for blood and organ collection. Comparative metabolomics analyses were performed as described in methods. Panel A. OPLS loadings S-plot displaying dysregulated features in irradiated tissue samples as compared to those from sham exposed group. Panel B. Two dimensional accuracy plot for top 50 features interrogated using Random Forests. The X-axis (dimension 1) denotes the interclass separation while Y-axis (dimension 2) displays the intra-class variability. Panel C. Heat map visualization of the feature rankings comparing relative levels of metabolites in control and irradiated GI tissue samples. Each row represents a unique feature with a characteristic mass to charge and retention time value.

