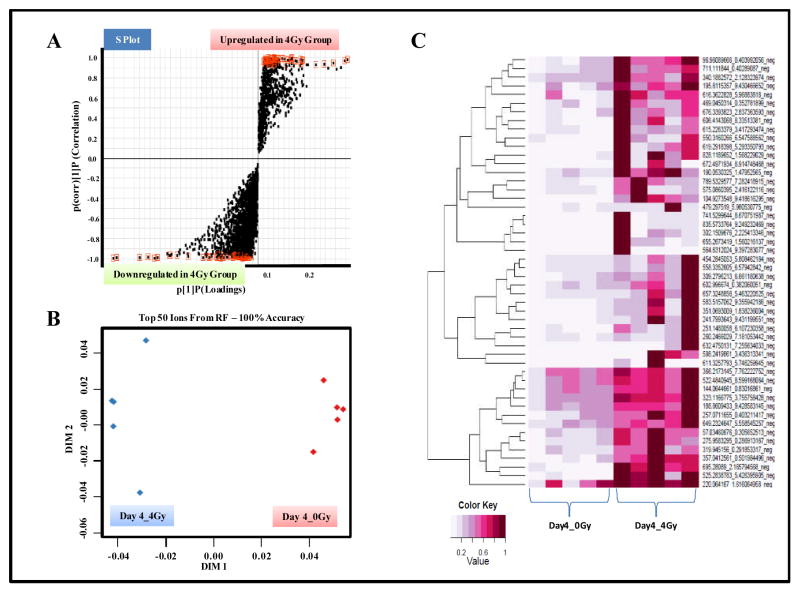
Figure 4. GI metabolomics shows a distinct metabolic response, 4 days post-IR exposure.
Panel A. OPLS loadings S-plot displaying significantly altered features in GI tissue samples obtained from irradiated mice as compared to sham exposed mice. Panel B. Two dimensional accuracy plot for top 50 features interrogated using Random Forests. Panel C. Heat map visualization of the feature rankings comparing relative levels in GI tissue samples obtained from sham and irradiated mice.

