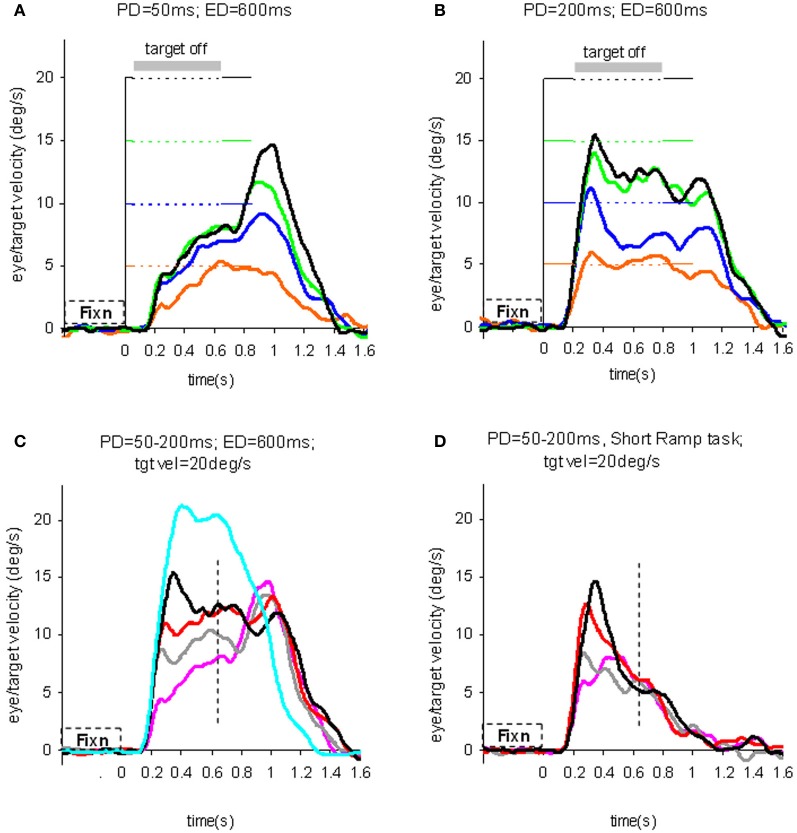
Figure 3.
Eye velocity trajectories during target extinction. Smooth eye velocity averaged across all six subjects in the Mid-ramp Extinction (A–C) and Short Ramp (D) tasks. In (A) and (B) target velocity = 5°/s (orange), 10°/s (blue), 15°/s (green), or 20°/s (black); PD = 50 ms in (A), PD = 200 ms in (B). In (C) and (D) target velocity = 20°/s; PD = 50 ms (magenta), 100 ms (gray), 150 ms (red), or 200 ms (black). Also shown in (C) is the average smooth eye velocity in the Control response for target velocity = 20°/s (cyan trace). In (C) and (D) dotted lines denote 650 ms after target onset; note that for these examples target extinction occurred at a different time for each data series. PD = initial target exposure duration; ED = duration of target extinction. From Barnes and Collins (2008a).

